Видимость 2.5D: области видимости и их охват
get_visibility считает каждое препятствие стеной бесконечной высоты. get_viewshed учитывает высоты зданий и рельеф: ячейка сетки видна, если луч зрения от глаз наблюдателя до ячейки проходит выше всех стен и выше земли. Этот ноутбук
сравнивает полигон видимости 2D с областями видимости 2.5D наблюдателя на улице и наблюдателя на крыше;
показывает влияние
target_heightи рельефа;подсчитывает для каждой ячейки, сколько из множества наблюдателей её видят, в 2D и в 2.5D (охват).
Метод описан на странице видимости.
Последний раздел, Своя территория, показывает, что заменить, чтобы получить такие же картинки для другой территории.
# !pip install objectnat pyarrow matplotlib
import geopandas as gpd

buildings = gpd.read_parquet("examples_data/buildings.parquet")  # EPSG:32636 (UTM 36N), metres
# 0 storeys means "unknown" in this dataset; such buildings get default_height below
buildings["storeys_count"] = buildings["storeys_count"].where(buildings["storeys_count"] > 0)
HEIGHTS = dict(height_column=None, storeys_column="storeys_count", storey_height=3.0, default_height=3.0)
buildings[["storeys_count", "geometry"]].describe()
| storeys_count | |
|---|---|
| count | 4100.000000 |
| mean | 3.243902 |
| std | 3.430774 |
| min | 1.000000 |
| 25% | 1.000000 |
| 50% | 1.000000 |
| 75% | 5.000000 |
| max | 24.000000 |
import matplotlib.pyplot as plt
import numpy as np
from mpl_toolkits.axes_grid1.anchored_artists import AnchoredSizeBar


def map_extent(ax, bounds, bar=100, outline=True):
    """Show `bounds` (x0, y0, x1, y1 in metres) without coordinate axes, with a scale bar and the area outline."""
    x0, y0, x1, y1 = bounds
    pad = 0.012 * max(x1 - x0, y1 - y0)
    ax.set_xlim(x0 - pad, x1 + pad)
    ax.set_ylim(y0 - pad, y1 + pad)
    ax.set_aspect("equal")
    ax.set_axis_off()
    if outline:
        ax.plot([x0, x1, x1, x0, x0], [y0, y0, y1, y1, y0], color="#3d3d3d", linewidth=1, zorder=8)
    scale = AnchoredSizeBar(ax.transData, bar, f"{bar:g} m", loc="lower right", pad=0.4, sep=4, size_vertical=bar / 40)
    scale.patch.set(facecolor="white", edgecolor="none", alpha=0.85)
    ax.add_artist(scale)
import shapely

from objectnat import get_viewshed, get_viewshed_catchment, get_visibility, get_visibility_catchment

centre = shapely.Point(346050, 6647450)
box = centre.buffer(350).envelope
scene = buildings[buildings.intersects(box.buffer(200))]


def open_points(area, spacing, min_dist=0.5, max_dist=None, obstacles=None):
    """Points every `spacing` m on open ground in `area`, optionally within `max_dist` m of a building."""
    x0, y0, x1, y1 = area.bounds
    xx, yy = np.meshgrid(np.arange(x0 + spacing / 2, x1, spacing), np.arange(y0 + spacing / 2, y1, spacing))
    pts = shapely.points(xx.ravel(), yy.ravel())
    obstacles = scene if obstacles is None else obstacles
    footprints = shapely.union_all(obstacles.geometry.values)
    keep = ~shapely.intersects(footprints.buffer(min_dist), pts)
    if max_dist is not None:
        keep &= shapely.intersects(footprints.buffer(max_dist), pts)
    return gpd.GeoDataFrame(geometry=pts[keep], crs=scene.crs)
1. Один наблюдатель: 2D и 2.5D
Наблюдатель на улице стоит в ближайшей к центру открытой точке; его глаза находятся на observer_height=1.6 м над землёй. Наблюдатель на крыше стоит в 1 м от края крыши самого высокого здания поблизости; наблюдатели внутри контура здания ставятся на его крышу. include_roofs=True возвращает также видимые части крыш.
import shapely.ops

candidates = open_points(centre.buffer(30), 5, min_dist=5)
street = candidates.iloc[[int(candidates.distance(centre).argmin())]]
tower = scene[scene.distance(street.geometry.iloc[0]) < 250].sort_values("storeys_count", ascending=False).iloc[0]
edge = shapely.ops.nearest_points(tower.geometry.boundary, street.geometry.iloc[0])[0]
roof = gpd.GeoDataFrame(geometry=[shapely.ops.nearest_points(tower.geometry.buffer(-1).boundary, edge)[0]], crs=scene.crs)

v2d = get_visibility(street, scene, view_distance=300)
v_street = get_viewshed(street, scene, 300, cell_size=2, **HEIGHTS)
v_roof = get_viewshed(roof, scene, 300, cell_size=2, include_roofs=True, **HEIGHTS)
print(f"2D visibility polygon: {v2d.area.iloc[0] / 1e4:.2f} ha")
print(f"viewshed, street:      {v_street['visible_area'].iloc[0] / 1e4:.2f} ha, share {v_street['visible_share'].iloc[0]:.1%}")
print(f"viewshed, roof of a {int(tower.storeys_count)}-storey building: {v_roof['visible_area'].iloc[0] / 1e4:.2f} ha")
2D visibility polygon: 2.79 ha
viewshed, street:      2.80 ha, share 12.4%
viewshed, roof of a 17-storey building: 9.59 ha
from matplotlib import colors as mcolors

hnorm = mcolors.Normalize(0, 50)
heights = scene["storeys_count"].fillna(1) * 3
fig, axs = plt.subplots(1, 3, figsize=(17, 5.8), constrained_layout=True)
for ax, result, observer, title in [
    (axs[0], v2d, street, "2D visibility polygon"),
    (axs[1], v_street, street, "2.5D viewshed, eye at 1.6 m"),
    (axs[2], v_roof, roof, "2.5D viewshed from the roof edge, roofs included"),
]:
    scene.plot(ax=ax, column=heights, cmap="Greys", norm=hnorm, edgecolor="#8c8c8c", linewidth=0.3)
    result.plot(ax=ax, color="#2b7bba", alpha=0.55, linewidth=0)
    observer.plot(ax=ax, color="#d7301f", markersize=30, edgecolor="white")
    map_extent(ax, box.bounds, outline=False)
    ax.set_title(title)
fig.colorbar(plt.cm.ScalarMappable(norm=hnorm, cmap="Greys"), ax=axs[2], shrink=0.7, label="building height, m")
plt.show()
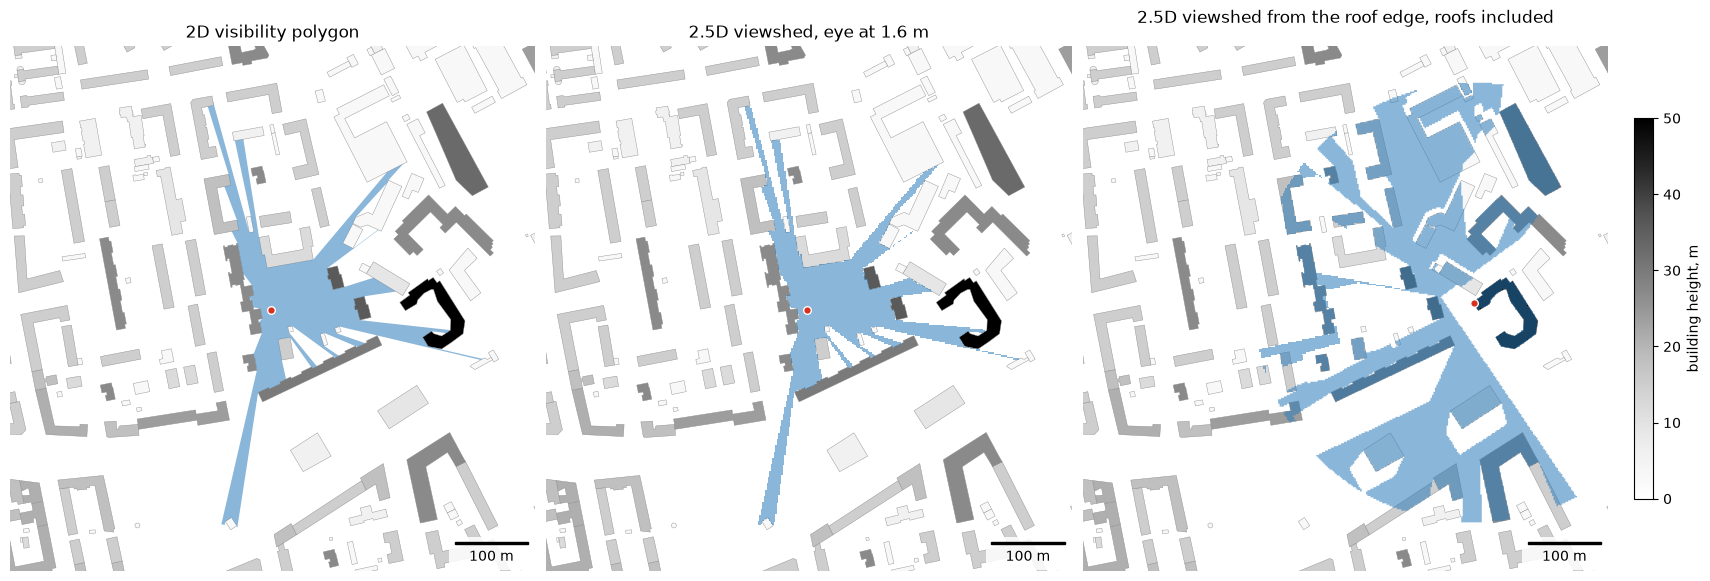
На ровной земле среди зданий выше уровня глаз область видимости с улицы совпадает с полигоном 2D с точностью до размера ячейки. Наблюдатель на крыше видит поверх более низких зданий.
2. Высота цели и рельеф
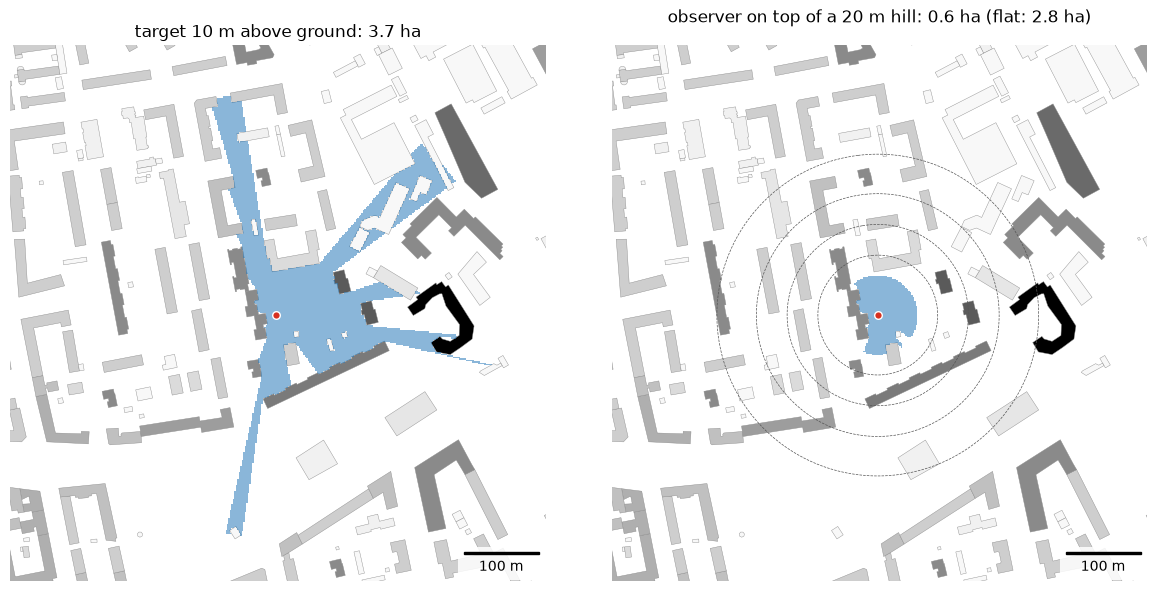
target_height — высота над землёй того, на что смотрят: 0 м для поверхности земли, 10 м для верхней части фасада или вывески. Рельеф задаётся так же, как для инсоляции (GeoDataFrame, GeoTIFF или массив); здесь синтетический гауссов холм высотой 20 м под наблюдателем на улице передаётся массивом с аффинным преобразованием. Здания тоже стоят на холме. От скруглённой вершины земля уходит вниз всё круче (выпуклый склон), поэтому лучи зрения от глаз на высоте 1,6 м проходят над нижними частями склона, и видимая земля сжимается до вершины: рельеф скрывает землю ниже, как это делают стены.
import pandas as pd

v_target = get_viewshed(street, scene, 300, cell_size=2, target_height=10, **HEIGHTS)
# smooth hill as an array: (heights, transform, crs), 2 m cells, 20 m high under the observer
o = street.geometry.iloc[0]
cell = 2.0
x0, y0 = box.bounds[0] - 200, box.bounds[3] + 200  # upper-left corner
cols = rows = int((box.bounds[2] - box.bounds[0] + 400) / cell)
xs = x0 + (np.arange(cols) + 0.5) * cell
ys = y0 - (np.arange(rows) + 0.5) * cell
dist2 = (xs[None, :] - o.x) ** 2 + (ys[:, None] - o.y) ** 2
heights_grid = 20.0 * np.exp(-dist2 / (2 * 120.0**2))
terrain = (heights_grid, (cell, 0.0, x0, 0.0, -cell, y0), scene.crs)
v_hill = get_viewshed(street, scene, 300, cell_size=2, terrain=terrain, **HEIGHTS)

fig, axs = plt.subplots(1, 2, figsize=(12, 5.8), constrained_layout=True)
for ax, result, title in [
    (axs[0], v_target, f"target 10 m above ground: {v_target['visible_area'].iloc[0] / 1e4:.1f} ha"),
    (axs[1], v_hill, f"observer on top of a 20 m hill: {v_hill['visible_area'].iloc[0] / 1e4:.1f} ha (flat: {v_street['visible_area'].iloc[0] / 1e4:.1f} ha)"),
]:
    scene.plot(ax=ax, column=heights, cmap="Greys", norm=hnorm, edgecolor="#8c8c8c", linewidth=0.3)
    result.plot(ax=ax, color="#2b7bba", alpha=0.55, linewidth=0)
    street.plot(ax=ax, color="#d7301f", markersize=30, edgecolor="white")
    map_extent(ax, box.bounds, outline=False)
    ax.set_title(title)
axs[1].contour(xs, ys, heights_grid, levels=[4, 8, 12, 16], colors="#555555", linewidths=0.5, linestyles="--")
plt.show()
3. Охват множества наблюдателей
Обычно наблюдателей расставляют вдоль улиц функцией get_observer_points(urban_graph, spacing=15) на пешеходном графе IduEdu. Чтобы ноутбук не зависел от загрузки данных OpenStreetMap, наблюдатели размещены через 15 м на открытой территории не дальше 12 м от зданий, что приближённо соответствует тротуарам и дворам. Они покрывают показанную территорию, расширенную на дальность обзора (250 м): ячейку у края территории видят и наблюдатели за её пределами, и без них её счёт получился бы заниженным.
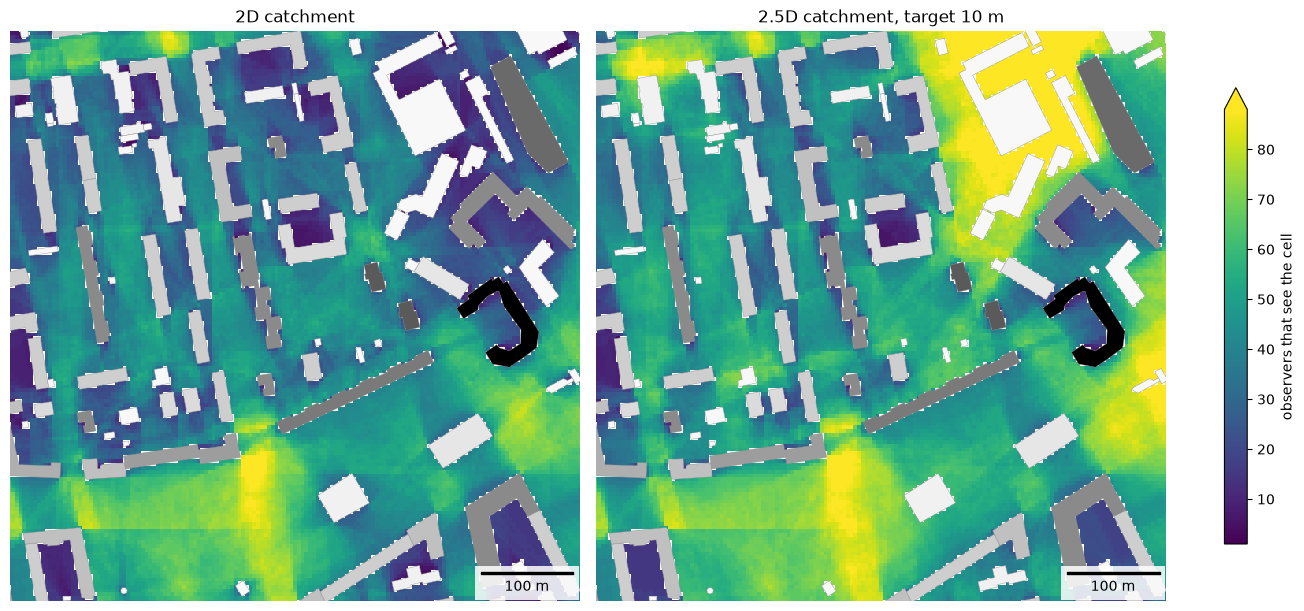
Каждая ячейка получает число наблюдателей, которые её видят; оба растра нарисованы в одной цветовой шкале. Охват 2.5D использует target_height=10: он считает наблюдателей, которые видят точку на высоте 10 м над землёй.
inner = box.buffer(-50, join_style="mitre")  # the area shown below
# observers also around it, up to the view distance; buildings far enough around them
wide_scene = buildings[buildings.intersects(inner.buffer(500))]
observers = open_points(inner.buffer(250, join_style="mitre"), 15, min_dist=2, max_dist=12, obstacles=wide_scene)
c2d = get_visibility_catchment(observers, wide_scene, view_distance=250, cell_size=4)
c25 = get_viewshed_catchment(observers, wide_scene, view_distance=250, cell_size=4, target_height=10, **HEIGHTS)
print(len(observers), "observers")
pd.DataFrame({"2D": c2d["count"].describe(), "2.5D": c25["count"].describe()}).round(1)
1805 observers
| 2D | 2.5D | |
|---|---|---|
| count | 97940.0 | 102814.0 |
| mean | 25.1 | 30.6 |
| std | 18.5 | 23.5 |
| min | 1.0 | 1.0 |
| 25% | 9.0 | 11.0 |
| 50% | 22.0 | 27.0 |
| 75% | 39.0 | 46.0 |
| max | 96.0 | 119.0 |
from objectnat import rasterize

rasters = {"2D catchment": rasterize(c2d, "count"), "2.5D catchment, target 10 m": rasterize(c25, "count")}
vmax = max(np.nanpercentile(r.values, 98) for r in rasters.values())  # one colour scale for both
fig, axs = plt.subplots(1, 2, figsize=(13, 6), constrained_layout=True)
for ax, (title, raster) in zip(axs, rasters.items()):
    im = raster.plot(ax=ax, cmap="viridis", vmin=1, vmax=vmax)
    scene.plot(ax=ax, column=heights, cmap="Greys", norm=hnorm, edgecolor="#8c8c8c", linewidth=0.3)
    map_extent(ax, inner.bounds, outline=False)
    ax.set_title(title)
fig.colorbar(im, ax=axs, shrink=0.8, extend="max", label="observers that see the cell")
plt.show()
4. Своя территория
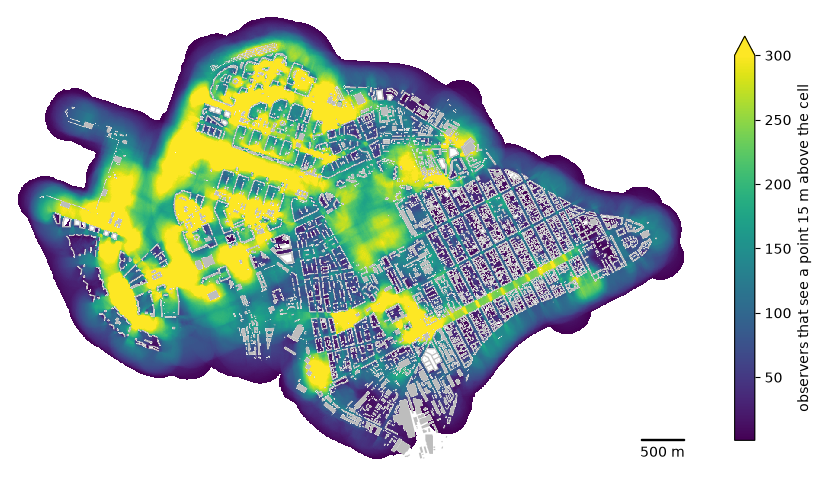
Наблюдатели через каждые 20 м вдоль пешеходного графа района из IduEdu (get_observer_points); здания служат только препятствиями и наблюдателей не добавляют. Около 44 тысяч наблюдателей рассчитываются за несколько секунд. Растр покрывает всё, что видят наблюдатели, в том числе за границей района. Значения зависят от шага наблюдателей, поэтому сравнивайте растры, построенные с одинаковым шагом. Raster.plot рисует растр, Raster.explore показывает его на веб-карте с цветовой шкалой, а Raster.to_geotiff записывает GeoTIFF для ГИС (нужен rasterio).
Наблюдатели стоят на земле, глаза на высоте observer_height=1.6 м, и смотрят вверх на точку на высоте target_height=15 м над землёй в каждой ячейке, например на вывеску или верхние этажи фасада: ячейка засчитывает наблюдателя, если луч зрения до этой точки проходит выше всех зданий. Такую точку видно поверх зданий ниже луча зрения, поэтому наблюдателей засчитывается больше, чем для земли (target_height=0).
import time

import iduedu

from objectnat import get_observer_points

OSM_ID, REGION = 1114252, "northwestern-fed-district"  # your territory
with iduedu.use_pbf(osm_id=OSM_ID, region=REGION):  # downloaded once, then cached
    my_boundary = iduedu.get_4326_boundary(osm_id=OSM_ID)
    my_walk = iduedu.get_walk_graph(territory=my_boundary, clip_by_territory=True)
my_observers = get_observer_points(my_walk, spacing=20)  # every 20 m along the pedestrian graph
my_buildings = buildings  # your footprints with heights or storeys (see HEIGHTS)

start = time.perf_counter()
cells = get_viewshed_catchment(my_observers, my_buildings, view_distance=250, cell_size=5, target_height=15,
                               **HEIGHTS)
print(f"{len(my_observers)} observers, {len(cells)} cells seen, {time.perf_counter() - start:.1f} s")

seen = rasterize(cells, "count")
fig, ax = plt.subplots(figsize=(11, 7.5))
im = seen.plot(ax=ax, cmap="viridis", vmin=1, vmax=300)
my_buildings.to_crs(seen.crs).plot(ax=ax, color="#bdbdbd", linewidth=0)
map_extent(ax, seen.bounds, bar=500, outline=False)
fig.colorbar(im, ax=ax, shrink=0.7, extend="max", label="observers that see a point 15 m above the cell")
plt.show()
# seen.to_geotiff("my_viewshed_count.tif")  # for GIS
2026-11-06 20:43:23.717 | WARNING | Removing 336 nodes outside the largest connected component. Retaining 19802 of 20138 nodes.
43799 observers, 767473 cells seen, 2.7 s
seen.explore(cmap="viridis", vmin=1, vmax=300, name="observers that see a point 15 m above the cell")
Ограничения
Крыши плоские, стены вертикальные; деревья и уличная мебель не закрывают обзор. Результаты дискретны с шагом cell_size, а время расчёта на наблюдателя растёт как (view_distance / cell_size) ** 2.