2.5D visibility: viewsheds and viewshed catchment
get_visibility treats every obstacle as a wall of infinite height. get_viewshed uses building heights and
terrain: a grid cell is visible when the line of sight from the observer’s eye to the cell passes above every wall
and above the ground. This notebook
compares a 2D visibility polygon with 2.5D viewsheds of a street observer and a roof observer;
shows the effect of
target_heightand terrain;counts, for every cell, how many of many observers see it, in 2D and in 2.5D (catchment).
The method is described on the visibility page.
The last section, Your own area, shows what to replace to get the same pictures for another territory.
# !pip install objectnat pyarrow matplotlib
import geopandas as gpd

buildings = gpd.read_parquet("examples_data/buildings.parquet")  # EPSG:32636 (UTM 36N), metres
# 0 storeys means "unknown" in this dataset; such buildings get default_height below
buildings["storeys_count"] = buildings["storeys_count"].where(buildings["storeys_count"] > 0)
HEIGHTS = dict(height_column=None, storeys_column="storeys_count", storey_height=3.0, default_height=3.0)
buildings[["storeys_count", "geometry"]].describe()
| storeys_count | |
|---|---|
| count | 4100.000000 |
| mean | 3.243902 |
| std | 3.430774 |
| min | 1.000000 |
| 25% | 1.000000 |
| 50% | 1.000000 |
| 75% | 5.000000 |
| max | 24.000000 |
import matplotlib.pyplot as plt
import numpy as np
from mpl_toolkits.axes_grid1.anchored_artists import AnchoredSizeBar


def map_extent(ax, bounds, bar=100, outline=True):
    """Show `bounds` (x0, y0, x1, y1 in metres) without coordinate axes, with a scale bar and the area outline."""
    x0, y0, x1, y1 = bounds
    pad = 0.012 * max(x1 - x0, y1 - y0)
    ax.set_xlim(x0 - pad, x1 + pad)
    ax.set_ylim(y0 - pad, y1 + pad)
    ax.set_aspect("equal")
    ax.set_axis_off()
    if outline:
        ax.plot([x0, x1, x1, x0, x0], [y0, y0, y1, y1, y0], color="#3d3d3d", linewidth=1, zorder=8)
    scale = AnchoredSizeBar(ax.transData, bar, f"{bar:g} m", loc="lower right", pad=0.4, sep=4, size_vertical=bar / 40)
    scale.patch.set(facecolor="white", edgecolor="none", alpha=0.85)
    ax.add_artist(scale)
import shapely

from objectnat import get_viewshed, get_viewshed_catchment, get_visibility, get_visibility_catchment

centre = shapely.Point(346050, 6647450)
box = centre.buffer(350).envelope
scene = buildings[buildings.intersects(box.buffer(200))]


def open_points(area, spacing, min_dist=0.5, max_dist=None, obstacles=None):
    """Points every `spacing` m on open ground in `area`, optionally within `max_dist` m of a building."""
    x0, y0, x1, y1 = area.bounds
    xx, yy = np.meshgrid(np.arange(x0 + spacing / 2, x1, spacing), np.arange(y0 + spacing / 2, y1, spacing))
    pts = shapely.points(xx.ravel(), yy.ravel())
    obstacles = scene if obstacles is None else obstacles
    footprints = shapely.union_all(obstacles.geometry.values)
    keep = ~shapely.intersects(footprints.buffer(min_dist), pts)
    if max_dist is not None:
        keep &= shapely.intersects(footprints.buffer(max_dist), pts)
    return gpd.GeoDataFrame(geometry=pts[keep], crs=scene.crs)
1. One observer: 2D and 2.5D
The street observer stands at the open point nearest to the centre; its eye is observer_height=1.6 m above the
ground. The roof observer stands 1 m inside the roof edge of the tallest building nearby; observers inside a
footprint are placed on its roof. include_roofs=True also returns the visible parts of roofs.
import shapely.ops

candidates = open_points(centre.buffer(30), 5, min_dist=5)
street = candidates.iloc[[int(candidates.distance(centre).argmin())]]
tower = scene[scene.distance(street.geometry.iloc[0]) < 250].sort_values("storeys_count", ascending=False).iloc[0]
edge = shapely.ops.nearest_points(tower.geometry.boundary, street.geometry.iloc[0])[0]
roof = gpd.GeoDataFrame(geometry=[shapely.ops.nearest_points(tower.geometry.buffer(-1).boundary, edge)[0]], crs=scene.crs)

v2d = get_visibility(street, scene, view_distance=300)
v_street = get_viewshed(street, scene, 300, cell_size=2, **HEIGHTS)
v_roof = get_viewshed(roof, scene, 300, cell_size=2, include_roofs=True, **HEIGHTS)
print(f"2D visibility polygon: {v2d.area.iloc[0] / 1e4:.2f} ha")
print(f"viewshed, street:      {v_street['visible_area'].iloc[0] / 1e4:.2f} ha, share {v_street['visible_share'].iloc[0]:.1%}")
print(f"viewshed, roof of a {int(tower.storeys_count)}-storey building: {v_roof['visible_area'].iloc[0] / 1e4:.2f} ha")
2D visibility polygon: 2.79 ha
viewshed, street:      2.80 ha, share 12.4%
viewshed, roof of a 17-storey building: 9.59 ha
from matplotlib import colors as mcolors

hnorm = mcolors.Normalize(0, 50)
heights = scene["storeys_count"].fillna(1) * 3
fig, axs = plt.subplots(1, 3, figsize=(17, 5.8), constrained_layout=True)
for ax, result, observer, title in [
    (axs[0], v2d, street, "2D visibility polygon"),
    (axs[1], v_street, street, "2.5D viewshed, eye at 1.6 m"),
    (axs[2], v_roof, roof, "2.5D viewshed from the roof edge, roofs included"),
]:
    scene.plot(ax=ax, column=heights, cmap="Greys", norm=hnorm, edgecolor="#8c8c8c", linewidth=0.3)
    result.plot(ax=ax, color="#2b7bba", alpha=0.55, linewidth=0)
    observer.plot(ax=ax, color="#d7301f", markersize=30, edgecolor="white")
    map_extent(ax, box.bounds, outline=False)
    ax.set_title(title)
fig.colorbar(plt.cm.ScalarMappable(norm=hnorm, cmap="Greys"), ax=axs[2], shrink=0.7, label="building height, m")
plt.show()
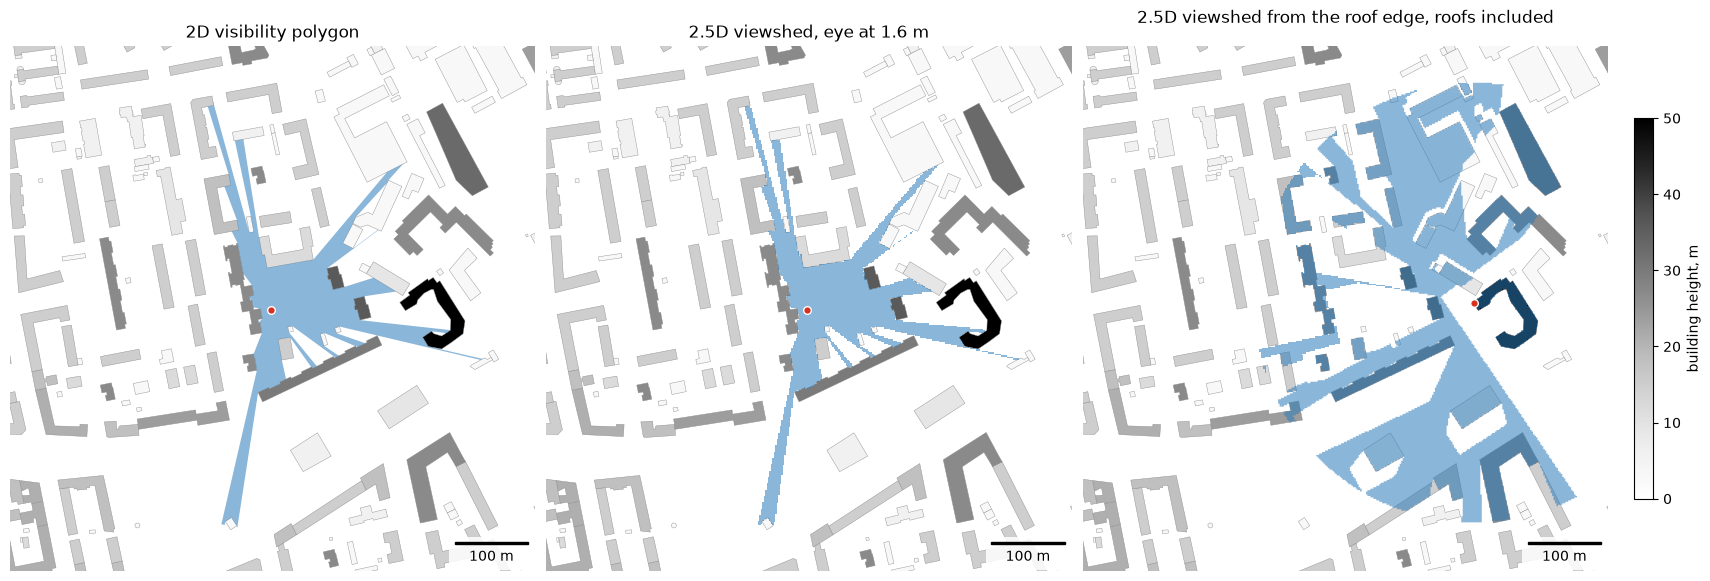
On flat ground, among buildings taller than the eye, the street viewshed coincides with the 2D polygon up to the cell size. The roof observer sees over the lower buildings.
2. Target height and terrain
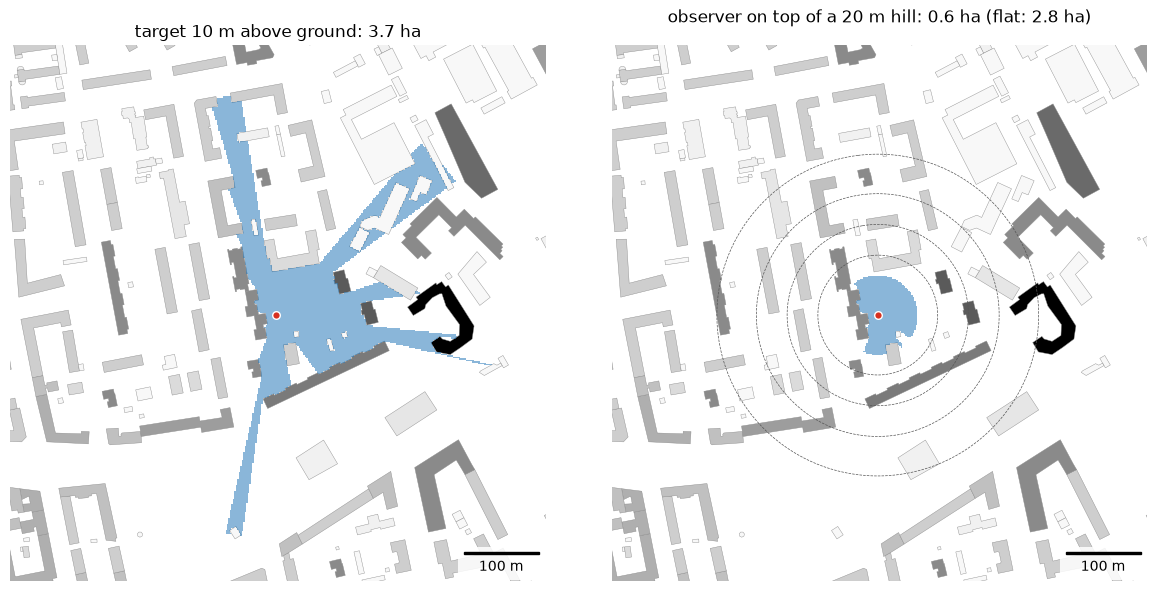
target_height is the height above the ground of what is looked at: 0 m for the ground surface, 10 m for the upper
part of a facade or a sign. Terrain is given as for insolation (GeoDataFrame, GeoTIFF or array); here a synthetic
Gaussian hill, 20 m high under the street observer, is passed as an array with an affine transform. The buildings
stand on the hill as well. From the rounded summit the ground falls away ever more steeply (a convex slope), so the
lines of sight from an eye 1.6 m above it pass over the lower slopes and the visible ground shrinks to the hilltop:
the terrain hides the ground below, as the walls do.
import pandas as pd

v_target = get_viewshed(street, scene, 300, cell_size=2, target_height=10, **HEIGHTS)
# smooth hill as an array: (heights, transform, crs), 2 m cells, 20 m high under the observer
o = street.geometry.iloc[0]
cell = 2.0
x0, y0 = box.bounds[0] - 200, box.bounds[3] + 200  # upper-left corner
cols = rows = int((box.bounds[2] - box.bounds[0] + 400) / cell)
xs = x0 + (np.arange(cols) + 0.5) * cell
ys = y0 - (np.arange(rows) + 0.5) * cell
dist2 = (xs[None, :] - o.x) ** 2 + (ys[:, None] - o.y) ** 2
heights_grid = 20.0 * np.exp(-dist2 / (2 * 120.0**2))
terrain = (heights_grid, (cell, 0.0, x0, 0.0, -cell, y0), scene.crs)
v_hill = get_viewshed(street, scene, 300, cell_size=2, terrain=terrain, **HEIGHTS)

fig, axs = plt.subplots(1, 2, figsize=(12, 5.8), constrained_layout=True)
for ax, result, title in [
    (axs[0], v_target, f"target 10 m above ground: {v_target['visible_area'].iloc[0] / 1e4:.1f} ha"),
    (axs[1], v_hill, f"observer on top of a 20 m hill: {v_hill['visible_area'].iloc[0] / 1e4:.1f} ha (flat: {v_street['visible_area'].iloc[0] / 1e4:.1f} ha)"),
]:
    scene.plot(ax=ax, column=heights, cmap="Greys", norm=hnorm, edgecolor="#8c8c8c", linewidth=0.3)
    result.plot(ax=ax, color="#2b7bba", alpha=0.55, linewidth=0)
    street.plot(ax=ax, color="#d7301f", markersize=30, edgecolor="white")
    map_extent(ax, box.bounds, outline=False)
    ax.set_title(title)
axs[1].contour(xs, ys, heights_grid, levels=[4, 8, 12, 16], colors="#555555", linewidths=0.5, linestyles="--")
plt.show()
3. Catchment of many observers
Observers are usually placed along streets with get_observer_points(urban_graph, spacing=15) on an IduEdu walk
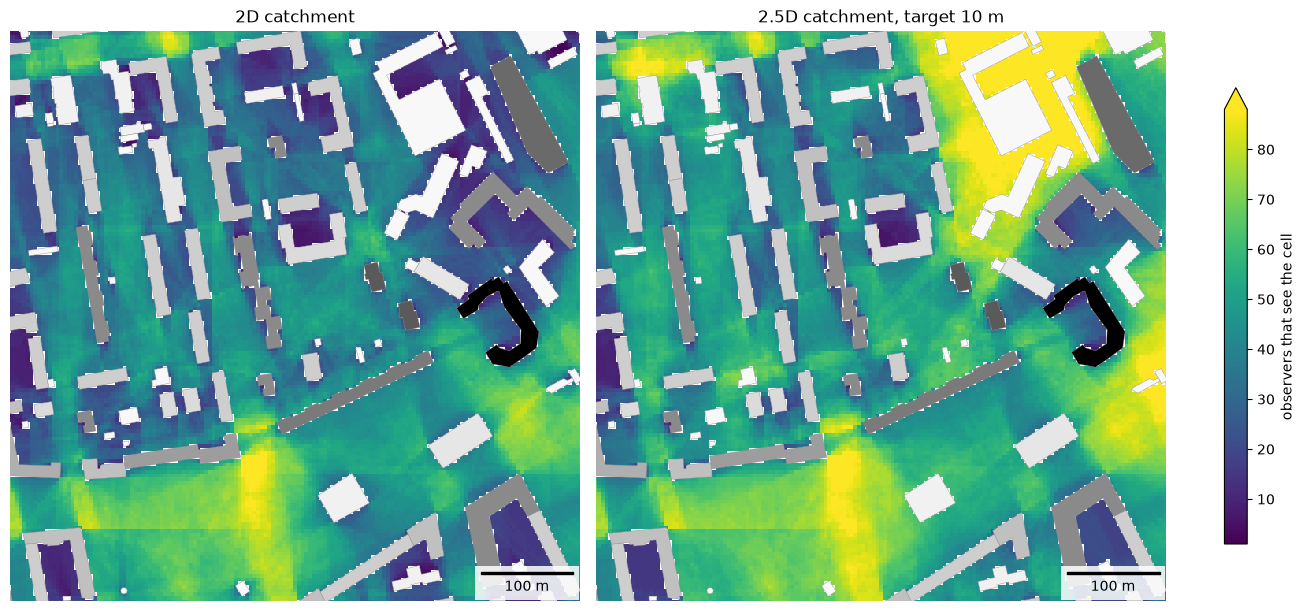
graph. To keep this notebook independent of OpenStreetMap downloads, observers are placed every 15 m on open ground
within 12 m of a building, which approximates sidewalks and yards. They cover the shown area extended by the view
distance (250 m): a cell near the edge of the area is also seen by observers outside it, and without them its
count would come out too low.
Each cell gets the number of observers that see it; both rasters are drawn on one colour scale. The 2.5D catchment uses target_height=10: it counts the observers that see a point 10 m above
the ground.
inner = box.buffer(-50, join_style="mitre")  # the area shown below
# observers also around it, up to the view distance; buildings far enough around them
wide_scene = buildings[buildings.intersects(inner.buffer(500))]
observers = open_points(inner.buffer(250, join_style="mitre"), 15, min_dist=2, max_dist=12, obstacles=wide_scene)
c2d = get_visibility_catchment(observers, wide_scene, view_distance=250, cell_size=4)
c25 = get_viewshed_catchment(observers, wide_scene, view_distance=250, cell_size=4, target_height=10, **HEIGHTS)
print(len(observers), "observers")
pd.DataFrame({"2D": c2d["count"].describe(), "2.5D": c25["count"].describe()}).round(1)
1805 observers
| 2D | 2.5D | |
|---|---|---|
| count | 97940.0 | 102814.0 |
| mean | 25.1 | 30.6 |
| std | 18.5 | 23.5 |
| min | 1.0 | 1.0 |
| 25% | 9.0 | 11.0 |
| 50% | 22.0 | 27.0 |
| 75% | 39.0 | 46.0 |
| max | 96.0 | 119.0 |
from objectnat import rasterize

rasters = {"2D catchment": rasterize(c2d, "count"), "2.5D catchment, target 10 m": rasterize(c25, "count")}
vmax = max(np.nanpercentile(r.values, 98) for r in rasters.values())  # one colour scale for both
fig, axs = plt.subplots(1, 2, figsize=(13, 6), constrained_layout=True)
for ax, (title, raster) in zip(axs, rasters.items()):
    im = raster.plot(ax=ax, cmap="viridis", vmin=1, vmax=vmax)
    scene.plot(ax=ax, column=heights, cmap="Greys", norm=hnorm, edgecolor="#8c8c8c", linewidth=0.3)
    map_extent(ax, inner.bounds, outline=False)
    ax.set_title(title)
fig.colorbar(im, ax=axs, shrink=0.8, extend="max", label="observers that see the cell")
plt.show()
4. Your own area
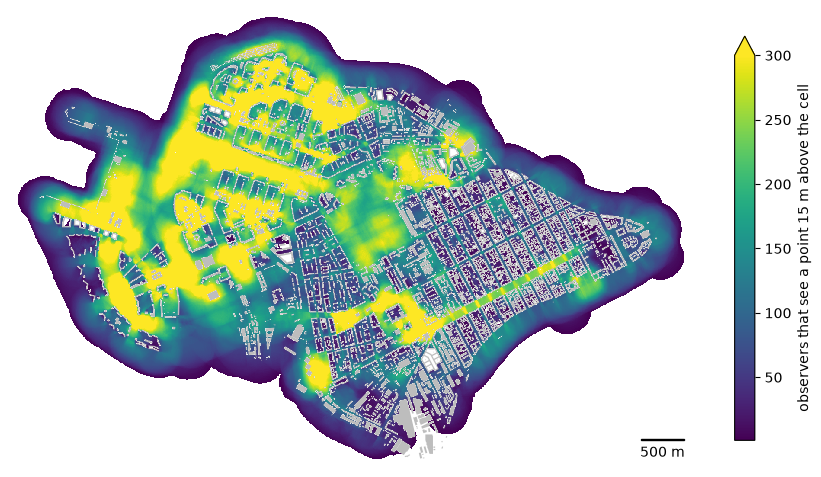
Observers every 20 m along the pedestrian graph of the district from IduEdu (get_observer_points); the buildings
are only obstacles, they add no observers. Some 44 thousand observers take a few seconds. The raster covers
everything the observers see, also beyond the district boundary. Counts depend on the observer spacing, so compare
rasters made with the same spacing. Raster.plot draws the raster, Raster.explore shows it on a web map with a
colour bar and Raster.to_geotiff writes a GeoTIFF for GIS (requires rasterio).
The observers stand on the ground with the eye at observer_height=1.6 m and look up at a point target_height=15 m
above the ground in every cell, for example a sign or the upper floors of a facade: a cell counts an observer when
the line of sight to that point passes above every building. Such a point is seen over buildings lower than the line
of sight, so more observers count than for the ground (target_height=0).
import time

import iduedu

from objectnat import get_observer_points

OSM_ID, REGION = 1114252, "northwestern-fed-district"  # your territory
with iduedu.use_pbf(osm_id=OSM_ID, region=REGION):  # downloaded once, then cached
    my_boundary = iduedu.get_4326_boundary(osm_id=OSM_ID)
    my_walk = iduedu.get_walk_graph(territory=my_boundary, clip_by_territory=True)
my_observers = get_observer_points(my_walk, spacing=20)  # every 20 m along the pedestrian graph
my_buildings = buildings  # your footprints with heights or storeys (see HEIGHTS)

start = time.perf_counter()
cells = get_viewshed_catchment(my_observers, my_buildings, view_distance=250, cell_size=5, target_height=15,
                               **HEIGHTS)
print(f"{len(my_observers)} observers, {len(cells)} cells seen, {time.perf_counter() - start:.1f} s")

seen = rasterize(cells, "count")
fig, ax = plt.subplots(figsize=(11, 7.5))
im = seen.plot(ax=ax, cmap="viridis", vmin=1, vmax=300)
my_buildings.to_crs(seen.crs).plot(ax=ax, color="#bdbdbd", linewidth=0)
map_extent(ax, seen.bounds, bar=500, outline=False)
fig.colorbar(im, ax=ax, shrink=0.7, extend="max", label="observers that see a point 15 m above the cell")
plt.show()
# seen.to_geotiff("my_viewshed_count.tif")  # for GIS
2026-11-06 20:43:23.717 | WARNING | Removing 336 nodes outside the largest connected component. Retaining 19802 of 20138 nodes.
43799 observers, 767473 cells seen, 2.7 s
seen.explore(cmap="viridis", vmin=1, vmax=300, name="observers that see a point 15 m above the cell")
Limitations
Roofs are flat and walls vertical; trees and street furniture do not block the view. Results are discrete at
cell_size, and computation time per observer grows with (view_distance / cell_size) ** 2.