Моделирование шума
В ObjectNat три модели шума с одинаковыми входными данными (уровень источника source_noise_db в дБ на расстоянии 1 м и характерная частота geometric_mean_freq_hz в Гц, для каждого источника или как аргументы):
simulate_noise_grid: уровни на сетке приёмников, прямые пути, отражения первого порядка и дифракция у углов зданий, энергетическое суммирование; точечные, линейные и площадные источники;simulate_noise: модель волнового фронта для точечных источников с многократными отражениями и растительностью;calculate_simplified_noise_frame: маски видимости и затухание с расстоянием для быстрой оценки.
Источники здесь — улица (линия через открытое пространство между кварталами) и два точечных источника.
Последний раздел, Своя территория, показывает, что заменить, чтобы получить такие же картинки для другой территории.
# !pip install objectnat pyarrow matplotlib
import geopandas as gpd
import matplotlib.pyplot as plt
import numpy as np
import pandas as pd
import shapely
from matplotlib import colors as mcolors

from objectnat import calculate_simplified_noise_frame, config, simulate_noise, simulate_noise_grid

config.set_enable_tqdm(False)

obstacles = gpd.read_parquet("examples_data/buildings.parquet")  # EPSG:32636, metres
trees = gpd.read_parquet("examples_data/trees.parquet")
import matplotlib.pyplot as plt
import numpy as np
from mpl_toolkits.axes_grid1.anchored_artists import AnchoredSizeBar


def map_extent(ax, bounds, bar=100, outline=True):
    """Show `bounds` (x0, y0, x1, y1 in metres) without coordinate axes, with a scale bar and the area outline."""
    x0, y0, x1, y1 = bounds
    pad = 0.012 * max(x1 - x0, y1 - y0)
    ax.set_xlim(x0 - pad, x1 + pad)
    ax.set_ylim(y0 - pad, y1 + pad)
    ax.set_aspect("equal")
    ax.set_axis_off()
    if outline:
        ax.plot([x0, x1, x1, x0, x0], [y0, y0, y1, y1, y0], color="#3d3d3d", linewidth=1, zorder=8)
    scale = AnchoredSizeBar(ax.transData, bar, f"{bar:g} m", loc="lower right", pad=0.4, sep=4, size_vertical=bar / 40)
    scale.patch.set(facecolor="white", edgecolor="none", alpha=0.85)
    ax.add_artist(scale)
centre = (346050, 6647450)
square = shapely.box(centre[0] - 300, centre[1] - 300, centre[0] + 300, centre[1] + 300)
scene = obstacles[obstacles.intersects(square.buffer(200))]
vegetation = trees[trees.intersects(square)]

street = shapely.LineString([(345805, 6647230), (345805, 6647650)])  # street between two blocks
points = gpd.GeoDataFrame(
    {"source_noise_db": [95.0, 85.0], "geometric_mean_freq_hz": [2000.0, 500.0]},
    geometry=[shapely.Point(346145, 6647505), shapely.Point(346240, 6647260)],
    crs=obstacles.crs,
)
road = gpd.GeoDataFrame({"source_noise_db": [80.0], "geometric_mean_freq_hz": [1000.0]}, geometry=[street], crs=obstacles.crs)
sources = pd.concat([road, points], ignore_index=True)
print("street crosses a building:", scene.intersects(street).any(),
      "| point inside a building:", scene.contains(points.union_all()).any())
sources
street crosses a building: False | point inside a building: False
| source_noise_db | geometric_mean_freq_hz | geometry | |
|---|---|---|---|
| 0 | 80.0 | 1000.0 | LINESTRING (345805 6647230, 345805 6647650) |
| 1 | 95.0 | 2000.0 | POINT (346145 6647505) |
| 2 | 85.0 | 500.0 | POINT (346240 6647260) |
def show_levels(ax, bands, title, lo=40, hi=95):
    cmap = plt.get_cmap("magma_r", int((hi - lo) / 5))
    norm = mcolors.Normalize(lo, hi)
    bands.plot(ax=ax, column="noise_level", cmap=cmap, norm=norm, linewidth=0)
    vegetation.clip(square).plot(ax=ax, facecolor="none", edgecolor="#2ca25f", hatch="///", linewidth=0.5)
    scene.clip(square).plot(ax=ax, color="#bdbdbd", edgecolor="#8c8c8c", linewidth=0.3)
    sources.plot(ax=ax, color="#2b7bba", linewidth=1.5, markersize=25)
    map_extent(ax, square.bounds)
    ax.set_title(title)
    return plt.cm.ScalarMappable(norm=norm, cmap=cmap)
1. Сетка приёмников
Приёмники размещаются с шагом grid_step метров; улица разбивается на точки с шагом source_spacing метров (по умолчанию 5), чтобы она следовала закону линейного источника. Уровни группируются в полосы по db_sim_step дБ (noise_level — верхняя граница полосы); output="both" возвращает также приёмники с точными уровнями, а output="receivers" — только приёмники.
import time

start = time.perf_counter()
grid_bands, receivers = simulate_noise_grid(
    sources, scene, trees=vegetation, grid_step=2, db_sim_step=5, target_noise_db=40,
    reflections=True, reflection_max_dist=50, output="both",
)
print(f"{len(receivers)} receivers above 40 dB in {time.perf_counter() - start:.1f} s")
receivers["noise_level"].describe().round(1)
45555 receivers above 40 dB in 3.6 s
count    45555.0
mean        51.8
std          9.2
min         40.0
25%         44.6
50%         49.6
75%         56.8
max         92.1
Name: noise_level, dtype: float64
fig, ax = plt.subplots(figsize=(7.5, 6.5), constrained_layout=True)
sm = show_levels(ax, grid_bands, "simulate_noise_grid")
fig.colorbar(sm, ax=ax, shrink=0.75, label="sound level, dB (band upper bound)")
plt.show()
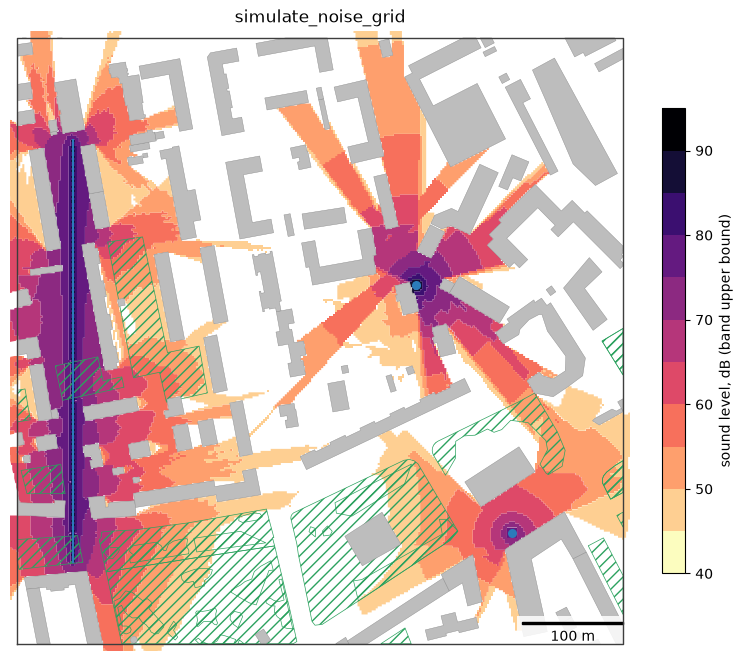
Полосы имеют ширину db_sim_step дБ; приёмники содержат точный непрерывный уровень. rasterize превращает их в растр на расчётной сетке, который показывает прибавку от вторичных путей: по сравнению с reflections=False отражения добавляют 1–3 дБ вдоль уличного каньона и образуют новые пучки там, где прямой звук перекрыт; по сравнению с diffraction=False дифракция заполняет тени рядом с пучками и за зданиями возле точечных источников (не больше чем на 20 дБ ниже свободного поля вокруг одного угла и на 25 дБ вокруг двух).
from objectnat import rasterize

common = dict(trees=vegetation, grid_step=2, target_noise_db=40, output="receivers")
no_reflections = simulate_noise_grid(sources, scene, reflections=False, **common)
no_diffraction = simulate_noise_grid(sources, scene, diffraction=False, **common)
# the runs share one grid; receivers reached only by the compared paths are compared with the 40 dB floor
key = lambda g: pd.MultiIndex.from_arrays([g.geometry.x.round(2), g.geometry.y.round(2)])
for column, other in [("by_reflections", no_reflections), ("by_diffraction", no_diffraction)]:
    other_level = pd.Series(other["noise_level"].to_numpy(), index=key(other))
    receivers[column] = receivers["noise_level"] - other_level.reindex(key(receivers)).fillna(40.0).to_numpy()

fig, axs = plt.subplots(1, 3, figsize=(20, 6), constrained_layout=True)
for ax, column, cmap, (lo, hi), label in [
    (axs[0], "noise_level", "magma_r", (40, 95), "sound level, dB"),
    (axs[1], "by_reflections", "viridis", (0, 10), "added by reflections, dB"),
    (axs[2], "by_diffraction", "viridis", (0, 10), "added by diffraction, dB"),
]:
    im = rasterize(receivers, column).plot(ax=ax, cmap=cmap, vmin=lo, vmax=hi)
    fig.colorbar(im, ax=ax, shrink=0.75, label=label)
    scene.clip(square).plot(ax=ax, color="#bdbdbd", edgecolor="#8c8c8c", linewidth=0.3)
    sources.plot(ax=ax, color="#2b7bba", linewidth=1.5, markersize=25)
    map_extent(ax, square.bounds)
plt.show()
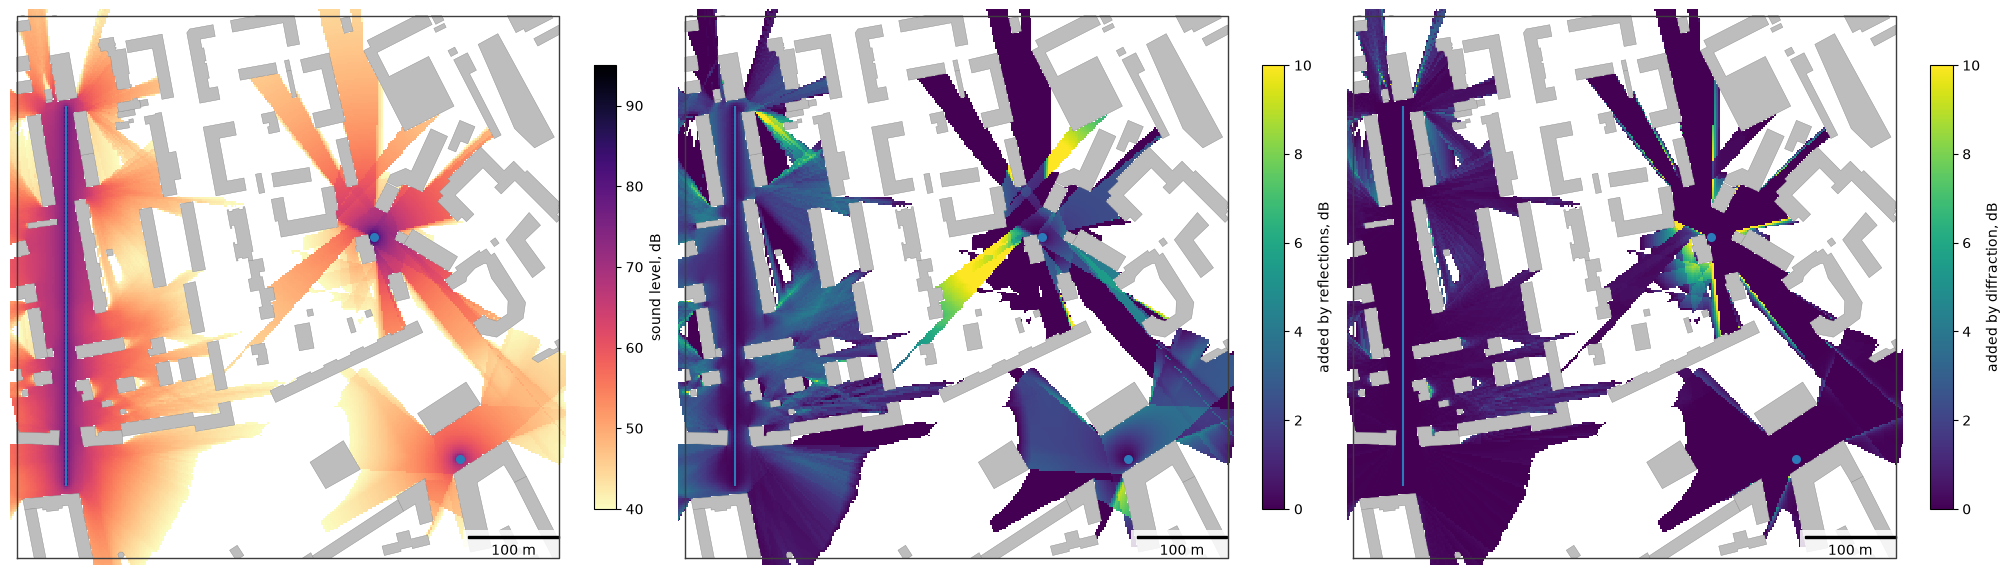
В этой модели два одинаковых источника дают +3 дБ, потому что энергии суммируются. Без отражений и дифракции за зданиями тихо:
direct_only = simulate_noise_grid(sources, scene, trees=vegetation, grid_step=2, db_sim_step=5, reflections=False,
                                  diffraction=False)
area = pd.DataFrame({
    "all paths, ha": grid_bands.set_index("noise_level").area / 1e4,
    "direct only, ha": direct_only.set_index("noise_level").area / 1e4,
}).fillna(0)
area.round(2)
| all paths, ha | direct only, ha | |
|---|---|---|
| noise_level | ||
| 45.0 | 4.90 | 3.87 |
| 50.0 | 4.52 | 3.71 |
| 55.0 | 3.32 | 2.57 |
| 60.0 | 2.01 | 1.57 |
| 65.0 | 1.20 | 1.01 |
| 70.0 | 1.08 | 0.92 |
| 75.0 | 0.70 | 0.55 |
| 80.0 | 0.26 | 0.22 |
| 85.0 | 0.08 | 0.08 |
| 90.0 | 0.00 | 0.00 |
| 95.0 | 0.00 | 0.00 |
2. Моделирование волнового фронта
simulate_noise принимает только точечные источники. Она распространяет звук слоями по db_sim_step дБ с не более чем reflection_n отражениями и ослаблением растительностью.
start = time.perf_counter()
wave = simulate_noise(
    source_points=points,
    obstacles=scene,
    standart_absorb_ratio=0.05,
    trees=vegetation,
    tree_resolution=4,
    air_temperature=20,
    target_noise_db=40,
    db_sim_step=5,
    reflection_n=2,
    dead_area_r=5,
    use_parallel=False,
)
print(f"{time.perf_counter() - start:.1f} s, {len(wave)} level bands")
3.6 s, 72 level bands
3. Упрощённый шумовой каркас
calculate_simplified_noise_frame принимает точечные, линейные и площадные источники и не требует моделирования распространения; препятствия служат только масками прямой видимости.
start = time.perf_counter()
frame = calculate_simplified_noise_frame(sources, scene, air_temperature=20, target_noise_db=40, db_sim_step=5)
print(f"{time.perf_counter() - start:.1f} s")

fig, axs = plt.subplots(1, 2, figsize=(14, 6.5), constrained_layout=True)
show_levels(axs[0], wave, "simulate_noise (point sources)")
sm = show_levels(axs[1], frame, "calculate_simplified_noise_frame")
fig.colorbar(sm, ax=axs, shrink=0.75, label="sound level, dB (band upper bound)")
plt.show()
0.2 s
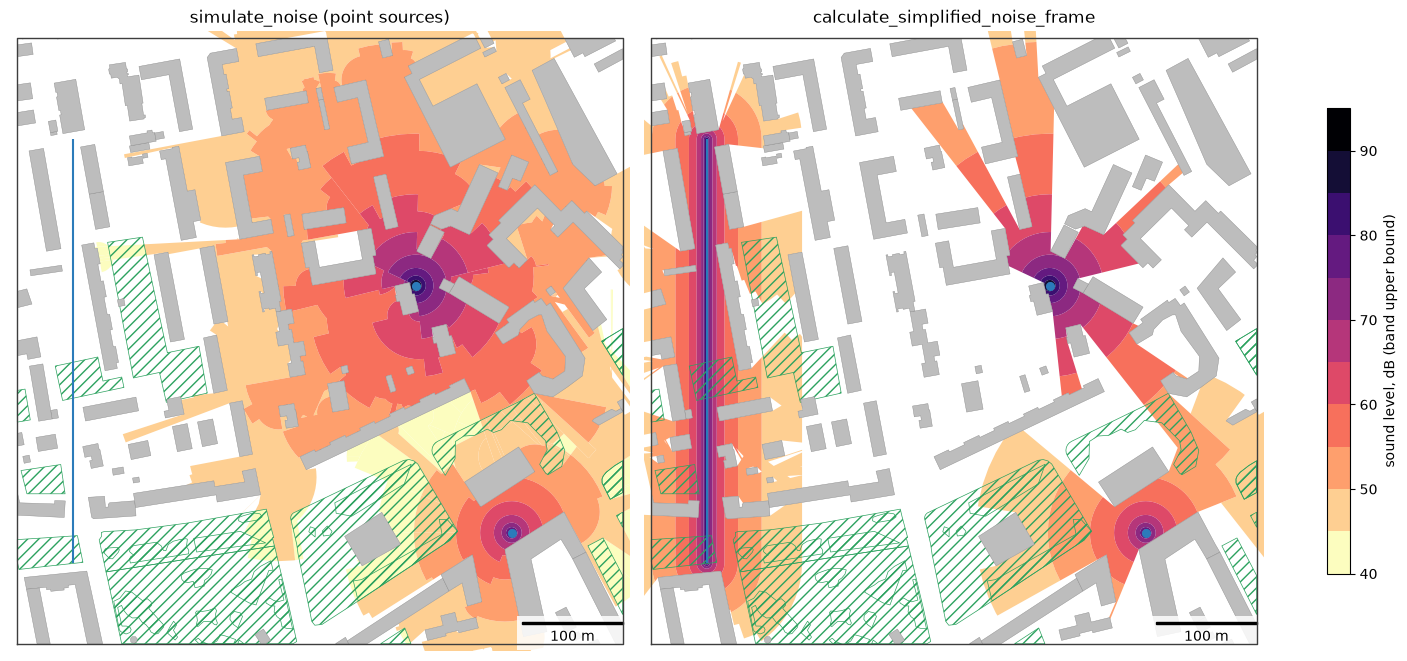
Модели различаются: simulate_noise_grid и simulate_noise учитывают отражения, упрощённый каркас — нет; simulate_noise и упрощённый каркас объединяют источники по максимуму полосы, simulate_noise_grid — энергетическим суммированием. Дифракцию у углов зданий учитывает только simulate_noise_grid; влияние земли не моделирует ни одна. См. страницу шума.
4. Своя территория
Источники (точки, дороги в виде линий, площадки в виде полигонов, с source_noise_db и geometric_mean_freq_hz) и здания: приёмники в виде растра точных уровней. Raster.plot рисует растр, Raster.explore показывает его на веб-карте с цветовой шкалой, а Raster.to_geotiff записывает GeoTIFF для ГИС (нужен rasterio).
my_sources = sources    # your sources, any CRS
my_buildings = scene    # your buildings (and trees=... for vegetation)

level = rasterize(simulate_noise_grid(my_sources, my_buildings, trees=vegetation, grid_step=2, output="receivers"),
                  "noise_level")
fig, ax = plt.subplots(figsize=(7.5, 6.5))
im = level.plot(ax=ax, cmap="magma_r", vmin=40, vmax=95)
my_buildings.clip(shapely.box(*level.bounds)).plot(ax=ax, color="#bdbdbd", linewidth=0)
map_extent(ax, level.bounds, outline=False)
fig.colorbar(im, ax=ax, shrink=0.8, label="sound level, dB")
plt.show()
# level.to_geotiff("my_noise.tif")  # for GIS
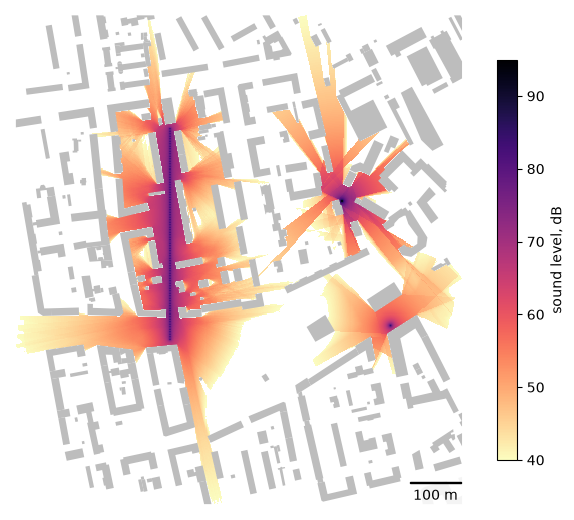
level.explore(cmap="magma_r", vmin=40, vmax=95, name="sound level, dB")