Инсоляция: часы солнца на земле и на фасадах
Этот ноутбук рассчитывает часы прямого солнечного света среди зданий известной высоты функциями get_insolation (приёмники на земле) и get_facade_insolation (точки на фасадах по этажам):
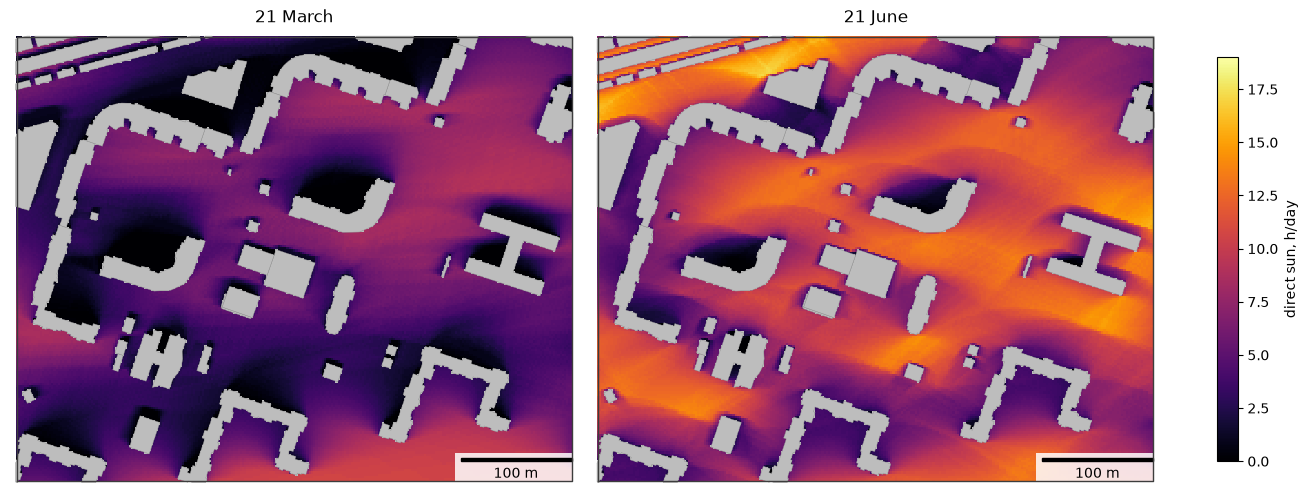
часы солнца за один день (равноденствие и летнее солнцестояние) в виде растров (
rasterize);период (22 апреля – 22 августа) с наибольшей непрерывной продолжительностью инсоляции в худший день;
влияние рельефа, заданного массивом, и растр на веб-карте (
Raster.explore);инсоляцию фасадов по этажам и проверку по нормативу непрерывной инсоляции.
У зданий из примера (Васильевский остров, Санкт-Петербург, 59,96° с. ш.) есть столбец storeys_count; высота — этажность × 3 м. Метод описан на странице инсоляции.
Последний раздел, Своя территория, показывает, что заменить, чтобы получить такие же картинки для другой территории.
# !pip install objectnat pyarrow matplotlib
import geopandas as gpd

buildings = gpd.read_parquet("examples_data/buildings.parquet")  # EPSG:32636 (UTM 36N), metres
# 0 storeys means "unknown" in this dataset; such buildings get default_height below
buildings["storeys_count"] = buildings["storeys_count"].where(buildings["storeys_count"] > 0)
HEIGHTS = dict(height_column=None, storeys_column="storeys_count", storey_height=3.0, default_height=3.0)
buildings[["storeys_count", "geometry"]].describe()
| storeys_count | |
|---|---|
| count | 4100.000000 |
| mean | 3.243902 |
| std | 3.430774 |
| min | 1.000000 |
| 25% | 1.000000 |
| 50% | 1.000000 |
| 75% | 5.000000 |
| max | 24.000000 |
import matplotlib.pyplot as plt
import numpy as np
from mpl_toolkits.axes_grid1.anchored_artists import AnchoredSizeBar


def map_extent(ax, bounds, bar=100, outline=True):
    """Show `bounds` (x0, y0, x1, y1 in metres) without coordinate axes, with a scale bar and the area outline."""
    x0, y0, x1, y1 = bounds
    pad = 0.012 * max(x1 - x0, y1 - y0)
    ax.set_xlim(x0 - pad, x1 + pad)
    ax.set_ylim(y0 - pad, y1 + pad)
    ax.set_aspect("equal")
    ax.set_axis_off()
    if outline:
        ax.plot([x0, x1, x1, x0, x0], [y0, y0, y1, y1, y0], color="#3d3d3d", linewidth=1, zorder=8)
    scale = AnchoredSizeBar(ax.transData, bar, f"{bar:g} m", loc="lower right", pad=0.4, sep=4, size_vertical=bar / 40)
    scale.patch.set(facecolor="white", edgecolor="none", alpha=0.85)
    ax.add_artist(scale)
1. Исследуемая территория
Жилая территория 500 × 400 м с дворами. В функции передаются все здания в пределах 300 м от неё, потому что здания за её пределами тоже отбрасывают на неё тени.
import shapely

from objectnat import get_facade_insolation, get_insolation

area = shapely.box(344750, 6649850, 345250, 6650250)  # in the CRS of the buildings
scene = buildings[buildings.intersects(area.buffer(300))]
shown = scene.clip(area.buffer(1))
print(f"{len(scene)} buildings in the scene, {len(shown)} in the area")
171 buildings in the scene, 50 in the area
2. Один день
date — один день. Приёмники размещаются с шагом grid_step метров вне контуров зданий, а положение солнца вычисляется каждые time_step_min минут. Результат — точки приёмников с sun_hours (0 — земля совсем без прямого солнца); attrs содержат моделируемые дни, продолжительность дня и сетку. rasterize превращает столбец в Raster на расчётной сетке, в какой бы системе координат ни были приёмники, а plot рисует его средствами matplotlib.
import time

import pandas as pd

days = {"2026-03-21": "21 March", "2026-06-21": "21 June"}
suns = {}
for day in days:
    start = time.perf_counter()
    suns[day] = get_insolation(scene, day, area=area, grid_step=2, time_step_min=10, **HEIGHTS)
    print(f"{day}: {time.perf_counter() - start:.1f} s, day length {suns[day].attrs['day_length_hours']:.1f} h")

pd.DataFrame({title: suns[day]["sun_hours"].describe() for day, title in days.items()}).round(2)
2026-03-21: 0.2 s, day length 12.2 h
2026-06-21: 0.2 s, day length 18.7 h
| 21 March | 21 June | |
|---|---|---|
| count | 41207.00 | 41207.00 |
| mean | 4.60 | 9.03 |
| std | 2.79 | 3.21 |
| min | 0.00 | 0.00 |
| 25% | 2.50 | 6.67 |
| 50% | 4.50 | 9.50 |
| 75% | 6.67 | 11.67 |
| max | 10.83 | 17.17 |
from objectnat import rasterize

fig, axs = plt.subplots(1, 2, figsize=(13, 5.2), constrained_layout=True)
for ax, (day, title) in zip(axs, days.items()):
    gpd.GeoSeries([area]).plot(ax=ax, color="#bdbdbd", zorder=0)  # cells without a receiver lie under buildings
    im = rasterize(suns[day], "sun_hours").plot(ax=ax, cmap="inferno", vmin=0, vmax=19)
    shown.plot(ax=ax, color="#bdbdbd", edgecolor="#8c8c8c", linewidth=0.3)
    map_extent(ax, area.bounds)
    ax.set_title(title)
fig.colorbar(im, ax=axs, shrink=0.8, label="direct sun, h/day")
plt.show()
3. Период и худший день
date=(start, end) моделирует каждый day_step-й день периода и его последний день. У точек приёмников есть sun_hours (среднее за моделируемые дни), min_sun_hours (худший день) и max_continuous_hours (наибольшая непрерывная продолжительность инсоляции в худший день), для которой нормативы инсоляции обычно задают минимум.
receivers = get_insolation(
    scene, ("2026-04-22", "2026-08-22"), area=area, grid_step=2, day_step=7, **HEIGHTS
)
print(len(receivers.attrs["days"]), "simulated days:", receivers.attrs["days"][0], "...", receivers.attrs["days"][-1])
receivers[["sun_hours", "min_sun_hours", "max_continuous_hours"]].describe().round(2)
19 simulated days: 2026-04-22 ... 2026-08-22
| sun_hours | min_sun_hours | max_continuous_hours | |
|---|---|---|---|
| count | 41207.00 | 41207.00 | 41207.00 |
| mean | 8.11 | 6.59 | 5.65 |
| std | 3.04 | 2.96 | 2.89 |
| min | 0.00 | 0.00 | 0.00 |
| 25% | 5.93 | 4.33 | 3.33 |
| 50% | 8.59 | 7.00 | 5.50 |
| 75% | 10.70 | 9.17 | 8.17 |
| max | 14.32 | 12.67 | 12.67 |
Обе карты нарисованы в одной цветовой шкале.
fig, axs = plt.subplots(1, 2, figsize=(13, 5.2), constrained_layout=True)
for ax, col, title in [
    (axs[0], "sun_hours", "22 April – 22 August, mean"),
    (axs[1], "max_continuous_hours", "22 April – 22 August, longest continuous sunlit period on the worst day"),
]:
    gpd.GeoSeries([area]).plot(ax=ax, color="#bdbdbd", zorder=0)  # cells without a receiver lie under buildings
    im = rasterize(receivers, col).plot(ax=ax, cmap="inferno", vmin=0, vmax=14)
    shown.plot(ax=ax, color="#bdbdbd", edgecolor="#8c8c8c", linewidth=0.3)
    map_extent(ax, area.bounds)
    ax.set_title(title)
fig.colorbar(im, ax=axs, shrink=0.8, label="direct sun, h/day")
plt.show()
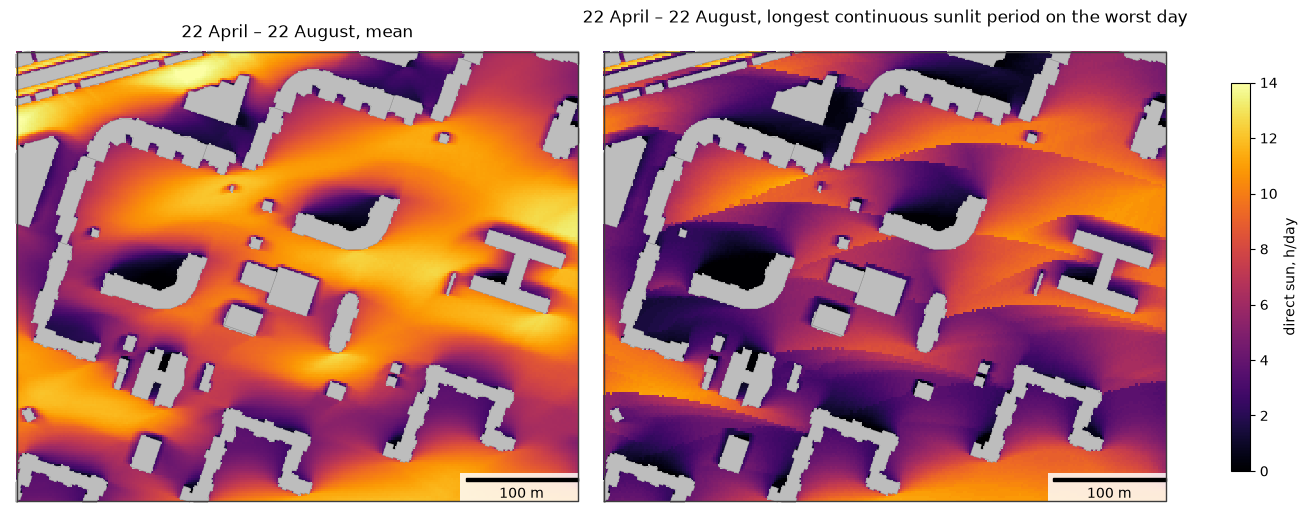
Доля открытой земли на территории, которая получает не меньше 3 ч непрерывного солнца в каждый моделируемый день:
share = (receivers["max_continuous_hours"] >= 3).mean()
print(f"{share:.0%} of the receivers")
81% of the receivers
4. Рельеф
Рельеф может быть GeoDataFrame полигонов с высотами (растеризуется с ячейками terrain_cell), путём к GeoTIFF или кортежем (heights, transform, crs); Raster тоже такой кортеж. Здесь синтетическая гряда высотой 50 м тянется с запада на восток с гребнем в 50 м к югу от территории и задана массивом с ячейками 5 м. Здания стоят на рельефе, и приёмники размещаются на нём, поэтому холм под самой территорией мало что меняет: важен рельеф, который поднимается выше линии на солнце, здесь — гряда между территорией и низким солнцем равноденствия.
from matplotlib import colors as mcolors

cell = 5.0
x0, y0, x1, y1 = area.buffer(400).bounds
cols, rows = int((x1 - x0) / cell), int((y1 - y0) / cell)
ys = y1 - (np.arange(rows) + 0.5) * cell  # row 0 is the northern edge
crest = area.bounds[1] - 50
ridge = 50.0 * np.exp(-((ys - crest) ** 2) / (2 * 30.0**2))
terrain = (np.repeat(ridge[:, None], cols, axis=1), (cell, 0.0, x0, 0.0, -cell, y1), buildings.crs)

flat = get_insolation(scene, "2026-03-21", area=area, grid_step=2, **HEIGHTS)
hilly = get_insolation(scene, "2026-03-21", area=area, grid_step=2, terrain=terrain, **HEIGHTS)
flat_r, hilly_r = rasterize(flat, "sun_hours"), rasterize(hilly, "sun_hours")
change = hilly_r.values - flat_r.values

fig, axs = plt.subplots(1, 3, figsize=(19, 5.2), constrained_layout=True)
for ax, raster, title in [(axs[0], flat_r, "21 March, flat ground"), (axs[1], hilly_r, "21 March, with the ridge")]:
    gpd.GeoSeries([area]).plot(ax=ax, color="#bdbdbd", zorder=0)
    im = raster.plot(ax=ax, cmap="inferno", vmin=0, vmax=12)
    shown.plot(ax=ax, color="#bdbdbd", edgecolor="#8c8c8c", linewidth=0.3)
    map_extent(ax, area.bounds)
    ax.set_title(title)
fig.colorbar(im, ax=axs[:2], shrink=0.8, label="direct sun, h/day")
gpd.GeoSeries([area]).plot(ax=axs[2], color="#bdbdbd", zorder=0)
im = type(flat_r)(change, flat_r.transform, flat_r.crs).plot(ax=axs[2], cmap="RdBu", norm=mcolors.TwoSlopeNorm(0, -6, 6))
shown.plot(ax=axs[2], color="#bdbdbd", edgecolor="#8c8c8c", linewidth=0.3)
map_extent(axs[2], area.bounds)
axs[2].set_title("ridge − flat")
fig.colorbar(im, ax=axs[2], shrink=0.8, label="change, h/day")
plt.show()
print(f"mean sun hours: flat {np.nanmean(flat_r.values):.2f} h, with the ridge {np.nanmean(hilly_r.values):.2f} h; "
      f"{np.nanmean(change < -1):.0%} of the open ground loses more than 1 h")
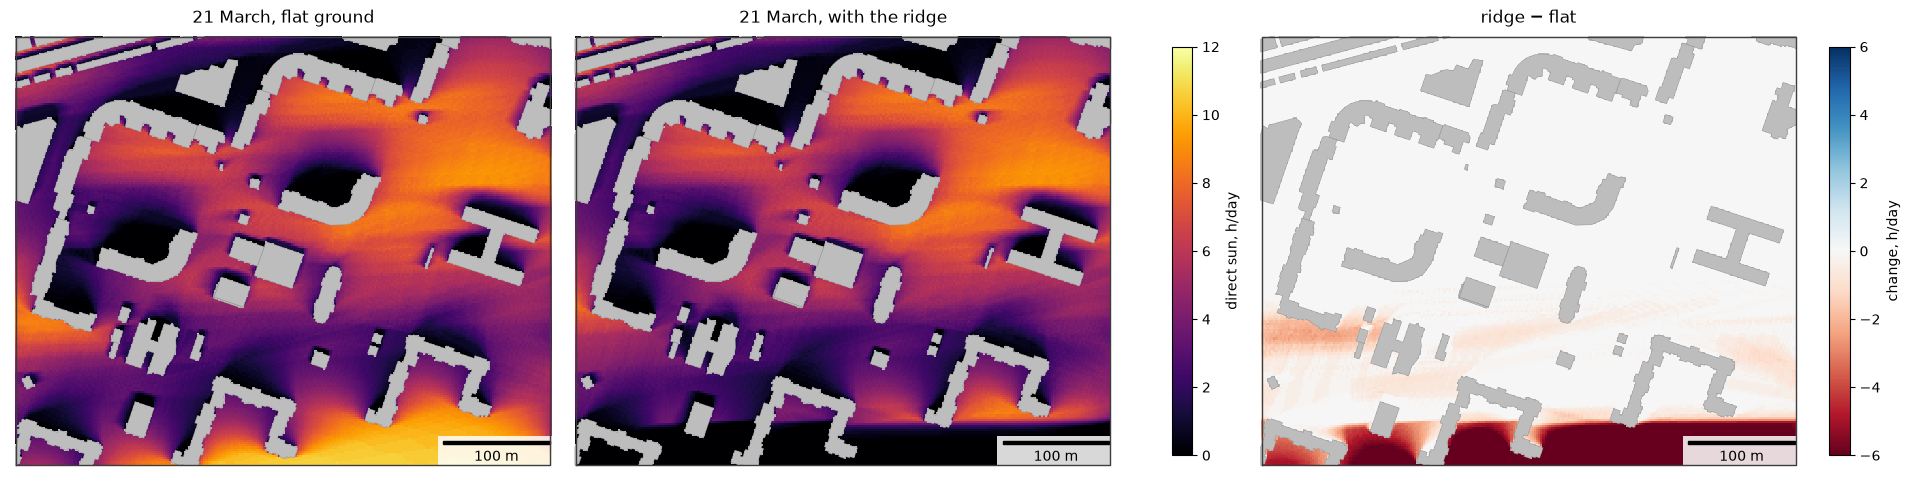
mean sun hours: flat 4.60 h, with the ridge 3.69 h; 11% of the open ground loses more than 1 h
Растры на веб-карте и в ГИС
Raster.explore показывает растр на карте folium с цветовой шкалой, как GeoDataFrame.explore(); чтобы добавить слой на существующую карту, передайте её первым аргументом. Веб-карты рисуют изображения в проекции Web Mercator, поэтому сетка сначала пересчитывается на сетку Меркатора и совпадает с подложкой; ячейки без значения прозрачны. Raster.to_folium возвращает сам слой изображения, а Raster.to_geotiff(path) записывает GeoTIFF для QGIS или ArcGIS (нужен rasterio).
hilly_r.explore(cmap="inferno", vmin=0, vmax=12, opacity=0.8, name="direct sun on 21 March, h")
5. Фасады по этажам
get_facade_insolation размещает точки с шагом spacing метров вдоль стен зданий, пересекающих area, на каждом этаже на высоте window_height над уровнем пола. Солнце учитывается, пока оно находится перед фасадом, а луч к нему свободен. norm_hours добавляет meets_norm — проверку наибольшей непрерывной продолжительности инсоляции.
В примере взяты 22 апреля и 2,5 ч непрерывного солнца в качестве нормативного значения; используйте расчётный день и значение норматива, которые относятся к проекту (для России — СанПиН 1.2.3685-21).
target = shapely.box(344900, 6649950, 345150, 6650200)
facades = get_facade_insolation(scene, "2026-04-22", area=target, spacing=3, window_height=1.2, norm_hours=2.5, **HEIGHTS)
print(len(facades), "facade points on", facades["building"].nunique(), "buildings")
facades.drop(columns="geometry").head()
14945 facade points on 25 buildings
| building | floor | height | facade_azimuth | sun_hours | min_sun_hours | max_continuous_hours | meets_norm | |
|---|---|---|---|---|---|---|---|---|
| 0 | 95 | 1 | 1.2 | 291.080748 | 2.500000 | 2.500000 | 2.166667 | False |
| 1 | 95 | 2 | 4.2 | 291.080748 | 2.666667 | 2.666667 | 2.333333 | False |
| 2 | 95 | 3 | 7.2 | 291.080748 | 2.833333 | 2.833333 | 2.500000 | True |
| 3 | 95 | 4 | 10.2 | 291.080748 | 2.833333 | 2.833333 | 2.500000 | True |
| 4 | 95 | 5 | 13.2 | 291.080748 | 3.000000 | 3.000000 | 2.666667 | True |
by_floor = facades.groupby("floor").agg(
    points=("meets_norm", "size"), meets_norm=("meets_norm", "mean"), continuous_h=("max_continuous_hours", "median")
)
by_floor["meets_norm"] = (100 * by_floor["meets_norm"]).round(1)
by_floor.rename(columns={"meets_norm": "meets norm, %", "continuous_h": "median continuous sun, h"})
| points | meets norm, % | median continuous sun, h | |
|---|---|---|---|
| floor | |||
| 1 | 1238 | 53.0 | 2.500000 |
| 2 | 969 | 55.9 | 2.833333 |
| 3 | 949 | 58.0 | 3.000000 |
| 4 | 949 | 59.0 | 3.166667 |
| 5 | 949 | 60.1 | 3.333333 |
| 6 | 949 | 61.6 | 3.500000 |
| 7 | 949 | 62.7 | 3.666667 |
| 8 | 949 | 64.2 | 3.833333 |
| 9 | 949 | 66.3 | 4.000000 |
| 10 | 949 | 68.0 | 4.166667 |
| 11 | 949 | 70.5 | 4.333333 |
| 12 | 949 | 72.9 | 4.666667 |
| 13 | 949 | 77.3 | 4.833333 |
| 14 | 949 | 82.2 | 5.666667 |
| 15 | 509 | 83.5 | 6.000000 |
| 16 | 509 | 87.4 | 6.500000 |
| 17 | 83 | 63.9 | 6.500000 |
| 18 | 83 | 68.7 | 6.500000 |
| 19 | 83 | 85.5 | 6.500000 |
| 20 | 83 | 89.2 | 6.500000 |
from matplotlib import colors as mcolors

norm = mcolors.Normalize(0, 8)
x0, y0, x1, y1 = target.buffer(20).bounds
fig, axs = plt.subplots(1, 3, figsize=(15, 5), constrained_layout=True)
for ax, floor in zip(axs, [1, 5, 10]):
    sub = facades[facades["floor"] == floor]
    scene.plot(ax=ax, color="#bdbdbd", edgecolor="#8c8c8c", linewidth=0.3)
    sub.plot(ax=ax, column="max_continuous_hours", cmap="inferno", norm=norm, markersize=6)
    map_extent(ax, (x0, y0, x1, y1), bar=50, outline=False)
    ax.set_title(f"floor {floor}: {sub['meets_norm'].mean():.0%} of points meet 2.5 h")
fig.colorbar(plt.cm.ScalarMappable(norm=norm, cmap="inferno"), ax=axs, shrink=0.7,
             label="longest continuous sun on 22 April, h")
plt.show()
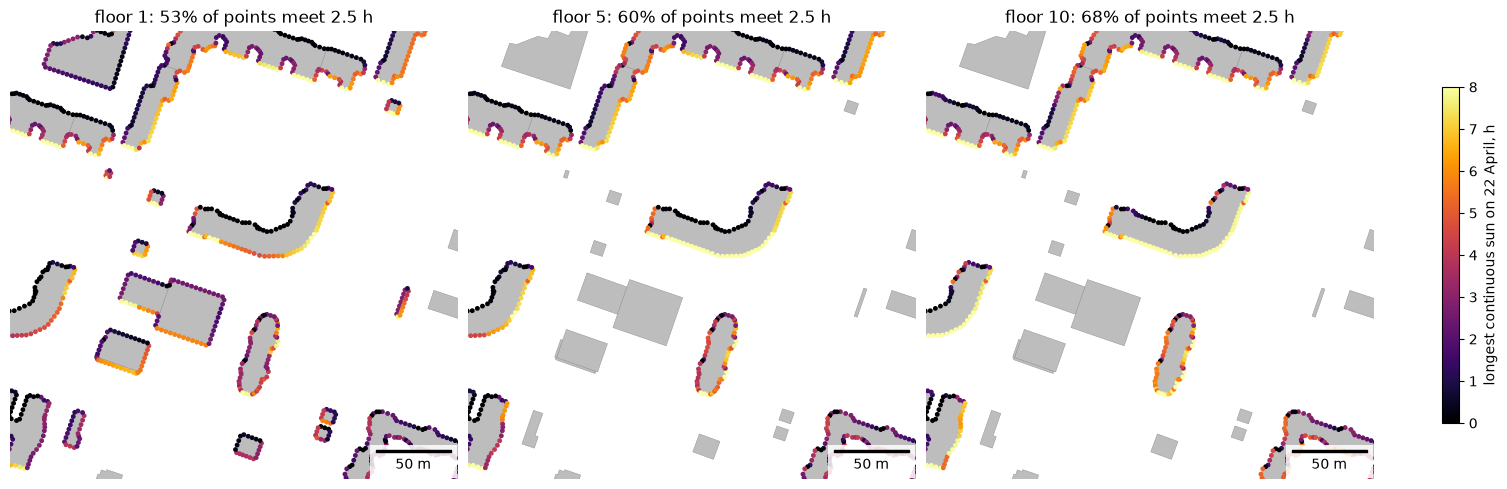
Здания с наименьшей долей точек на фасадах первого этажа, проходящих по нормативу:
ground = facades[facades["floor"] == 1]
per_building = ground.groupby("building")["meets_norm"].agg(["size", "mean"]).rename(
    columns={"size": "points", "mean": "share meeting norm"}
)
per_building.sort_values("share meeting norm").head(5).round(2)
| points | share meeting norm | |
|---|---|---|
| building | ||
| 1274 | 59 | 0.22 |
| 102 | 95 | 0.37 |
| 408 | 20 | 0.40 |
| 2841 | 22 | 0.41 |
| 95 | 203 | 0.48 |
6. Своя территория
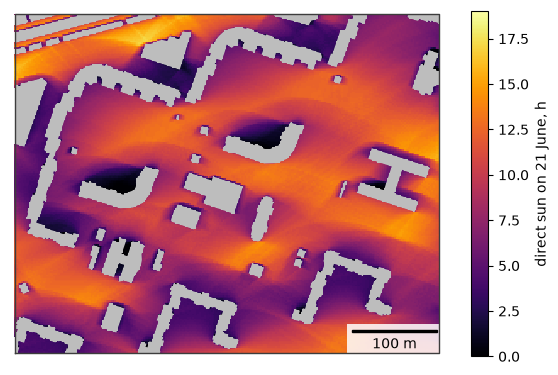
Контуры зданий с высотами или этажностью и территория. Здания вокруг территории отбрасывают на неё тени, поэтому передайте и их. Raster.plot рисует растр, Raster.explore показывает его на веб-карте с цветовой шкалой, а Raster.to_geotiff записывает GeoTIFF для ГИС (нужен rasterio).
my_buildings = buildings                                  # your footprints; HEIGHTS names the height columns
my_area = shapely.box(344750, 6649850, 345250, 6650250)   # your area, in the CRS of the buildings
my_scene = my_buildings[my_buildings.intersects(my_area.buffer(300))]

sun = rasterize(get_insolation(my_scene, "2026-06-21", area=my_area, grid_step=2, **HEIGHTS),
                "sun_hours")
fig, ax = plt.subplots(figsize=(7, 5.6))
gpd.GeoSeries([my_area]).plot(ax=ax, color="#bdbdbd", zorder=0)  # cells without a receiver lie under buildings
im = sun.plot(ax=ax, cmap="inferno", vmin=0, vmax=19)
my_scene.clip(my_area).plot(ax=ax, color="#bdbdbd", linewidth=0)
map_extent(ax, my_area.bounds)
fig.colorbar(im, ax=ax, shrink=0.8, label="direct sun on 21 June, h")
plt.show()
# sun.to_geotiff("my_sun_hours.tif")  # for GIS
sun.explore(cmap="inferno", vmin=0, vmax=19, name="direct sun on 21 June, h")
Ограничения
Крыши плоские; балконы, лоджии, оконные откосы и деревья не моделируются, учитывается только прямой солнечный свет. Значения кратны time_step_min. Подробнее — на странице инсоляции.