Зоны покрытия
Этот ноутбук строит зоны покрытия сервисов из примера на интермодальном графе UrbanGraph: каждое место относится к сервису, до которого сетевая стоимость в пределах бюджета минимальна, поэтому зоны не перекрываются. Он показывает
get_graph_coverageпо расстоянию (800 м) и по времени (10 мин);get_stepped_graph_coverageпоясами по 2 минуты в виде ячеек Вороного и в виде независимых буферов;get_radius_coverageбез графа.
Метод описан на странице зон покрытия. Интерактивные карты показывают облегчённую копию каждого результата (for_map: контуры упрощены на 2 м), чтобы ноутбук оставался небольшим.
Последний раздел, Своя территория, показывает, что заменить, чтобы получить такие же картинки для другой территории.
# Install required packages (uncomment if needed)
# !pip install iduedu pyarrow objectnat
import geopandas as gpd
import iduedu
from iduedu import get_4326_boundary, get_intermodal_graph

from objectnat import get_graph_coverage, get_radius_coverage, get_stepped_graph_coverage
import folium


def for_map(gdf, tolerance=2.0):
    """A light copy for a web map: outlines simplified by `tolerance` metres, coordinates rounded to about 10 cm."""
    local = gdf.to_crs(gdf.estimate_utm_crs())
    local["geometry"] = local.simplify(tolerance)
    light = local.to_crs(4326)
    light["geometry"] = light.geometry.set_precision(1e-6)
    return light[~light.is_empty]

def grey_tiles():
    """Light grey base map (Esri World Light Gray); its tiles end at zoom 16 and are stretched beyond it."""
    return folium.TileLayer("Esri.WorldGrayCanvas", max_zoom=19, max_native_zoom=16)
1. Интермодальный граф
# Vasilyevsky Island district, Saint Petersburg (OSM relation 1114252).
# IduEdu cuts the territory out of the Geofabrik extract (pip install "iduedu[pbf]");
# without the `with` block the same calls query the Overpass API.
with iduedu.use_pbf(osm_id=1114252, region="northwestern-fed-district"):
    poly = get_4326_boundary(osm_id=1114252)
    G_intermodal = get_intermodal_graph(territory=poly, clip_by_territory=True)
2026-11-06 19:16:01.201 | WARNING | iduedu.graph.transformers:keep_largest_connected_component:64 - Removing 338 nodes outside the largest strongly connected component. Retaining 21181 of 21519 nodes.
2026-11-06 19:16:01.224 | WARNING | iduedu.graph_builders.intermodal_builders:join_pt_walk_graph:248 - Public transport nodes dropped with the smaller components: {'trolleybus': 2}
2. Сервисы
36 сервисов со столбцами name и capacity (EPSG:32636).
services = gpd.read_parquet('examples_data/services.parquet')
3. Покрытие по расстоянию
Зоны в пределах 800 м сетевого расстояния (weight_type="length_meter").
# Calculate coverage zones by distance (800m cutoff)
result_length = get_graph_coverage(
    G_intermodal,
    gdf_destinations=services,
    weight_type="length_meter",
    weight_value_cutoff=800,
)

# Coverage results are indexed like the input services. Join service attributes
# back by index before coloring or filtering by service columns such as "name".
result_length = result_length.join(services[['name']], how="left")

# Visualize results
for_map(result_length).explore(column='name', legend=False, tiles=grey_tiles())
4. Покрытие по времени
Зоны в пределах 10 минут (weight_type="time_min"), обрезанные по границе района через zone.
# Prepare zone boundary
zone = gpd.GeoDataFrame(geometry=[poly], crs=4326)

# Calculate coverage zones by time (10min cutoff)
result_time = get_graph_coverage(
    G_intermodal,
    gdf_destinations=services,
    weight_type="time_min",
    weight_value_cutoff=10,
    zone=zone,
)

# Coverage results preserve the input service index, so service attributes can
# be joined back by index for visualization.
result_time = result_time.join(services[['name']], how="left")

# Visualize results
for_map(result_time).explore(column='name', legend=False, tiles=grey_tiles())
Использованные параметры
weight_type:"length_meter"(метры) или"time_min"(минуты);weight_value_cutoff: бюджет в единицахweight_type;zone(необязательно): полигон, по которому обрезаются зоны; без него они обрезаются по вогнутой оболочке достижимых узлов;geometry_type(необязательно):"radius"или"ways"дополнительно обрезает зоны по буферам остаточного расстояния или по буферам улиц.
5. Ступенчатое покрытие по времени
Обслуживаемая территория, разбитая на пояса по 2 минуты до 15 минут, с двумя значениями geometry_type:
None: ячейки Вороного узлов графа;"separate": независимые буферы для каждого пояса, без ячеек Вороного.
"radius" и "ways" обрезают те же пояса Вороного по буферам остаточного расстояния или по буферам улиц, как в ноутбуке изохрон.
stepped_cov_voronoi = get_stepped_graph_coverage(
    G_intermodal,
    gdf_destinations=services,
    weight_type="time_min",
    geometry_type=None,
    weight_value_cutoff=15,
    step=2,
    zone=zone,
)
# Visualize stepped coverage
for_map(stepped_cov_voronoi).explore(column='dist', tiles=grey_tiles())
stepped_cov_separate = get_stepped_graph_coverage(
    G_intermodal,
    gdf_destinations=services,
    weight_type="time_min",
    geometry_type='separate',
    weight_value_cutoff=15,
    step=2,
)
# Visualize stepped coverage
for_map(stepped_cov_separate).explore(column='dist', tiles=grey_tiles(), vmin=0)
6. Покрытие по радиусу
Без графа: полигоны Вороного сервисов, обрезанные по буферам 500 м.
radius_cov = get_radius_coverage(gdf_from=services[['name','geometry']], radius=500)
# Visualize radius coverage
for_map(radius_cov).explore(column='name', legend=False, tiles=grey_tiles())
7. Своя территория
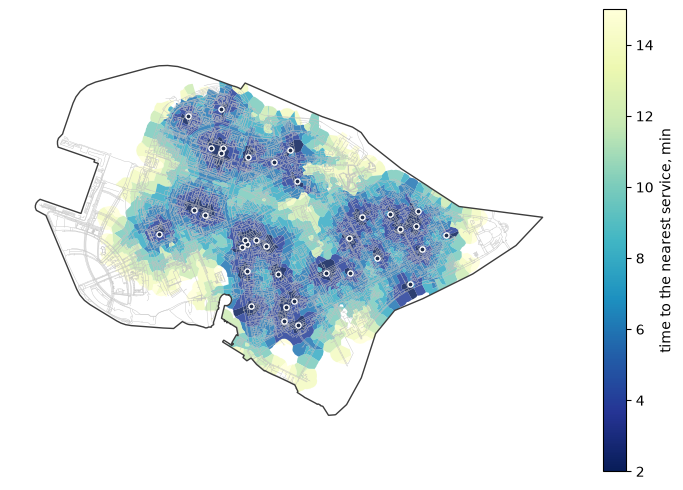
Территория — отношение OSM (relation района или города на openstreetmap.org); REGION задаёт выгрузку Geofabrik, из которой она вырезается (iduedu.find_geofabrik_region находит её по полигону; без неё IduEdu один раз обращается к Overpass, чтобы выбрать выгрузку). Результат — GeoDataFrame: нарисуйте его в matplotlib (здесь поверх улиц графа, с границей территории), посмотрите на веб-карте или сохраните для ГИС через to_file.
import matplotlib.pyplot as plt

OSM_ID, REGION = 1114252, "northwestern-fed-district"  # your territory
my_services = services  # your services: points in any CRS

with iduedu.use_pbf(osm_id=OSM_ID, region=REGION):  # downloaded once, then cached
    my_boundary = get_4326_boundary(osm_id=OSM_ID)
    my_graph = get_intermodal_graph(territory=my_boundary, clip_by_territory=True)
my_bands = get_stepped_graph_coverage(
    my_graph, gdf_destinations=my_services, weight_type="time_min", weight_value_cutoff=15, step=2,
    zone=gpd.GeoDataFrame(geometry=[my_boundary], crs=4326),
)

local = my_bands.to_crs(my_graph.nodes_gdf.crs)
streets = my_graph.edges_gdf[my_graph.edges_gdf["type"] == "walk"]  # the street network as the background
ax = streets.plot(color="#c2c2c2", linewidth=0.3, figsize=(9, 6))
local.plot(ax=ax, column="dist", cmap="YlGnBu_r", alpha=0.85, legend=True,
           legend_kwds={"label": "time to the nearest service, min"})
gpd.GeoSeries([my_boundary], crs=4326).to_crs(local.crs).boundary.plot(ax=ax, color="#3d3d3d", linewidth=1)
my_services.to_crs(local.crs).plot(ax=ax, color="#1f2d4d", markersize=14, edgecolor="white", zorder=5)
ax.set_axis_off()
plt.show()
# my_bands.to_file("my_coverage.gpkg")  # for GIS
2026-11-06 19:16:16.427 | WARNING | iduedu.graph.transformers:keep_largest_connected_component:64 - Removing 338 nodes outside the largest strongly connected component. Retaining 21181 of 21519 nodes.
2026-11-06 19:16:16.458 | WARNING | iduedu.graph_builders.intermodal_builders:join_pt_walk_graph:248 - Public transport nodes dropped with the smaller components: {'trolleybus': 2}
for_map(my_bands).explore(column="dist", cmap="YlGnBu_r", tiles=grey_tiles())