Graph Coverage Zones from Points
Coverage zones represent areas that can be reached from multiple source points within a certain time or distance limit using a transport network. They are built by calculating reachability per point, generating Voronoi polygons, and optionally clipping them to a defined boundary.
The library supports several methods for generating coverage zones, depending on whether you use a full transport graph or simplified geometric rules.
Coverage Using Transport Graph
Uses a full routing engine to determine reachable areas per point, then builds coverage zones based on actual network paths.
- objectnat.get_graph_coverage(gdf_to, nx_graph, weight_type, weight_value_cutoff=None, zone=None)[source]
Calculate coverage zones from source points through a graph network using Dijkstra’s algorithm and Voronoi diagrams.
- The function works by:
Finding nearest graph nodes for each input point
Calculating all reachable nodes within cutoff distance using Dijkstra
Creating Voronoi polygons around graph nodes
Combining reachability information with Voronoi cells
Clipping results to specified zone boundary
- Parameters:
gdf_to (
geopandas.GeoDataFrame) – Source points to which coverage is calculated.nx_graph (
networkx.Graph) – NetworkX graph representing the transportation network.weight_type (
Literal['time_min','length_meter']) –Type of edge weight to use for path calculation:
"time_min": Edge travel time in minutes"length_meter": Edge length in meters
weight_value_cutoff (
float) – Maximum weight value for path calculations (e.g., max travel time/distance).zone (
geopandas.GeoDataFrame) – Boundary polygon to clip the resulting coverage zones. If None, concave hull of reachable nodes will be used.
- Returns:
GeoDataFrame with coverage zones polygons, each associated with its source point, returns in the same CRS as original gdf_from.
- Return type:
gpd.GeoDataFrame
Notes
The graph must have a valid CRS attribute in its graph properties
MultiGraph/MultiDiGraph inputs will be converted to simple Graph/DiGraph
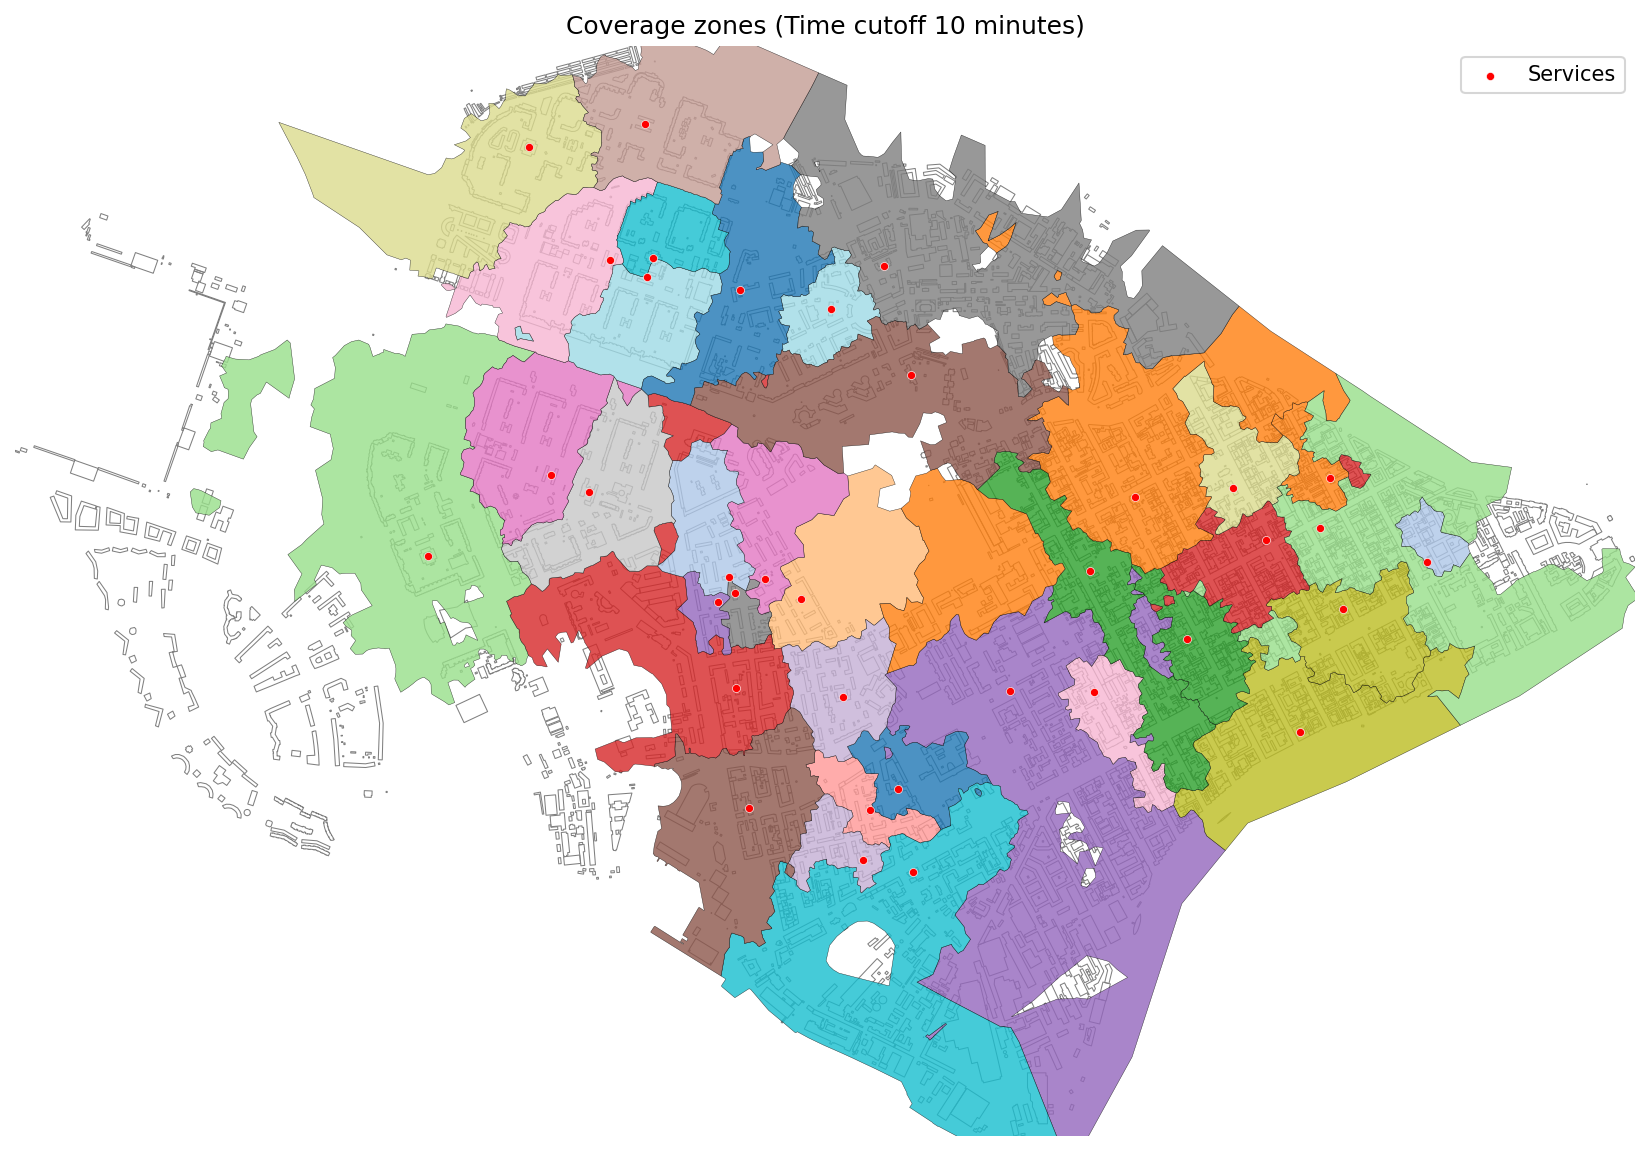
Coverage zones generated by travel time (10 minutes) on a transport graph.
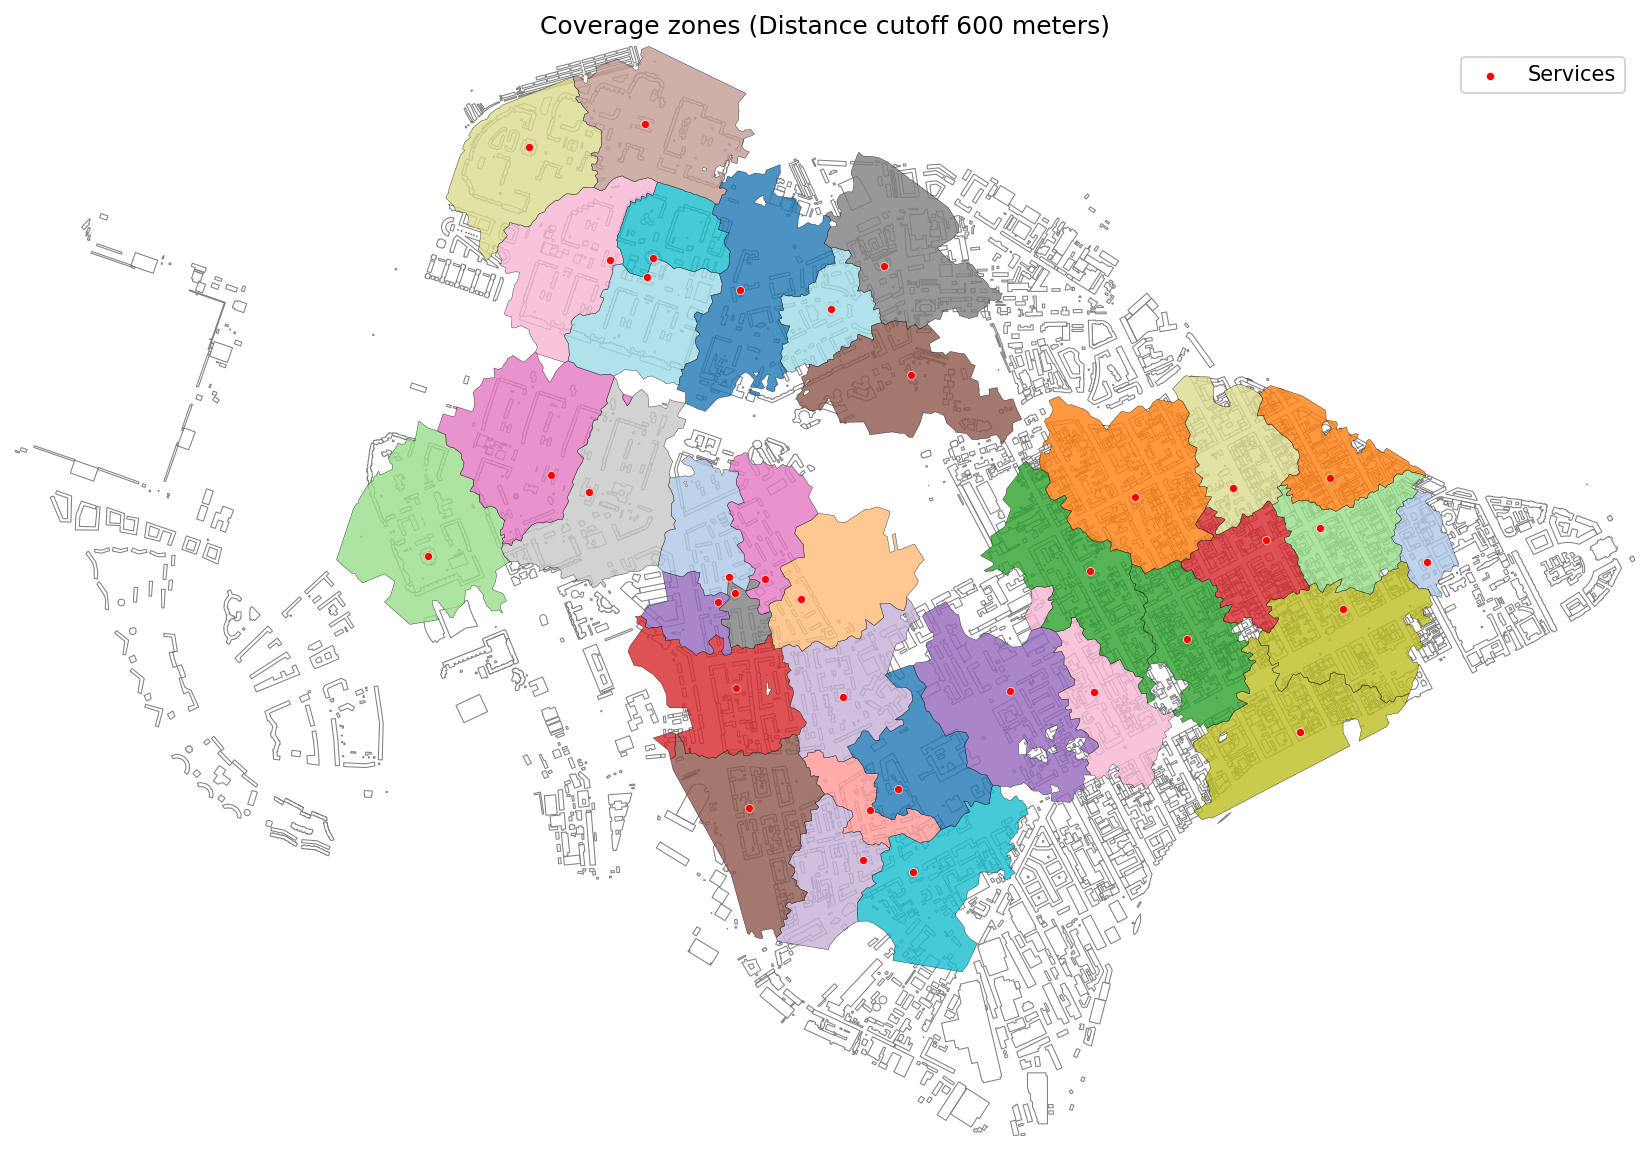
Coverage zones generated by distance (600 meters) on a transport graph.
Coverage Using Radius Only
Generates fixed radius-based buffers per point without routing, then merges or clips them via Voronoi diagrams for cleaner borders.
- objectnat.get_radius_coverage(gdf_from, radius, resolution=32)[source]
Calculate radius-based coverage zones using Voronoi polygons.
- Parameters:
gdf_from (
geopandas.GeoDataFrame) – Source points for which coverage zones are calculated.radius (
float) – Maximum coverage radius in meters.resolution (
int) – Number of segments used to approximate quarter-circle in buffer (default=32).
- Returns:
GeoDataFrame with smoothed coverage zone polygons in the same CRS as original gdf_from.
- Return type:
gpd.GeoDataFrame
Notes
Automatically converts to local UTM CRS for accurate distance measurements
Final zones are slightly contracted then expanded for smoothing effect
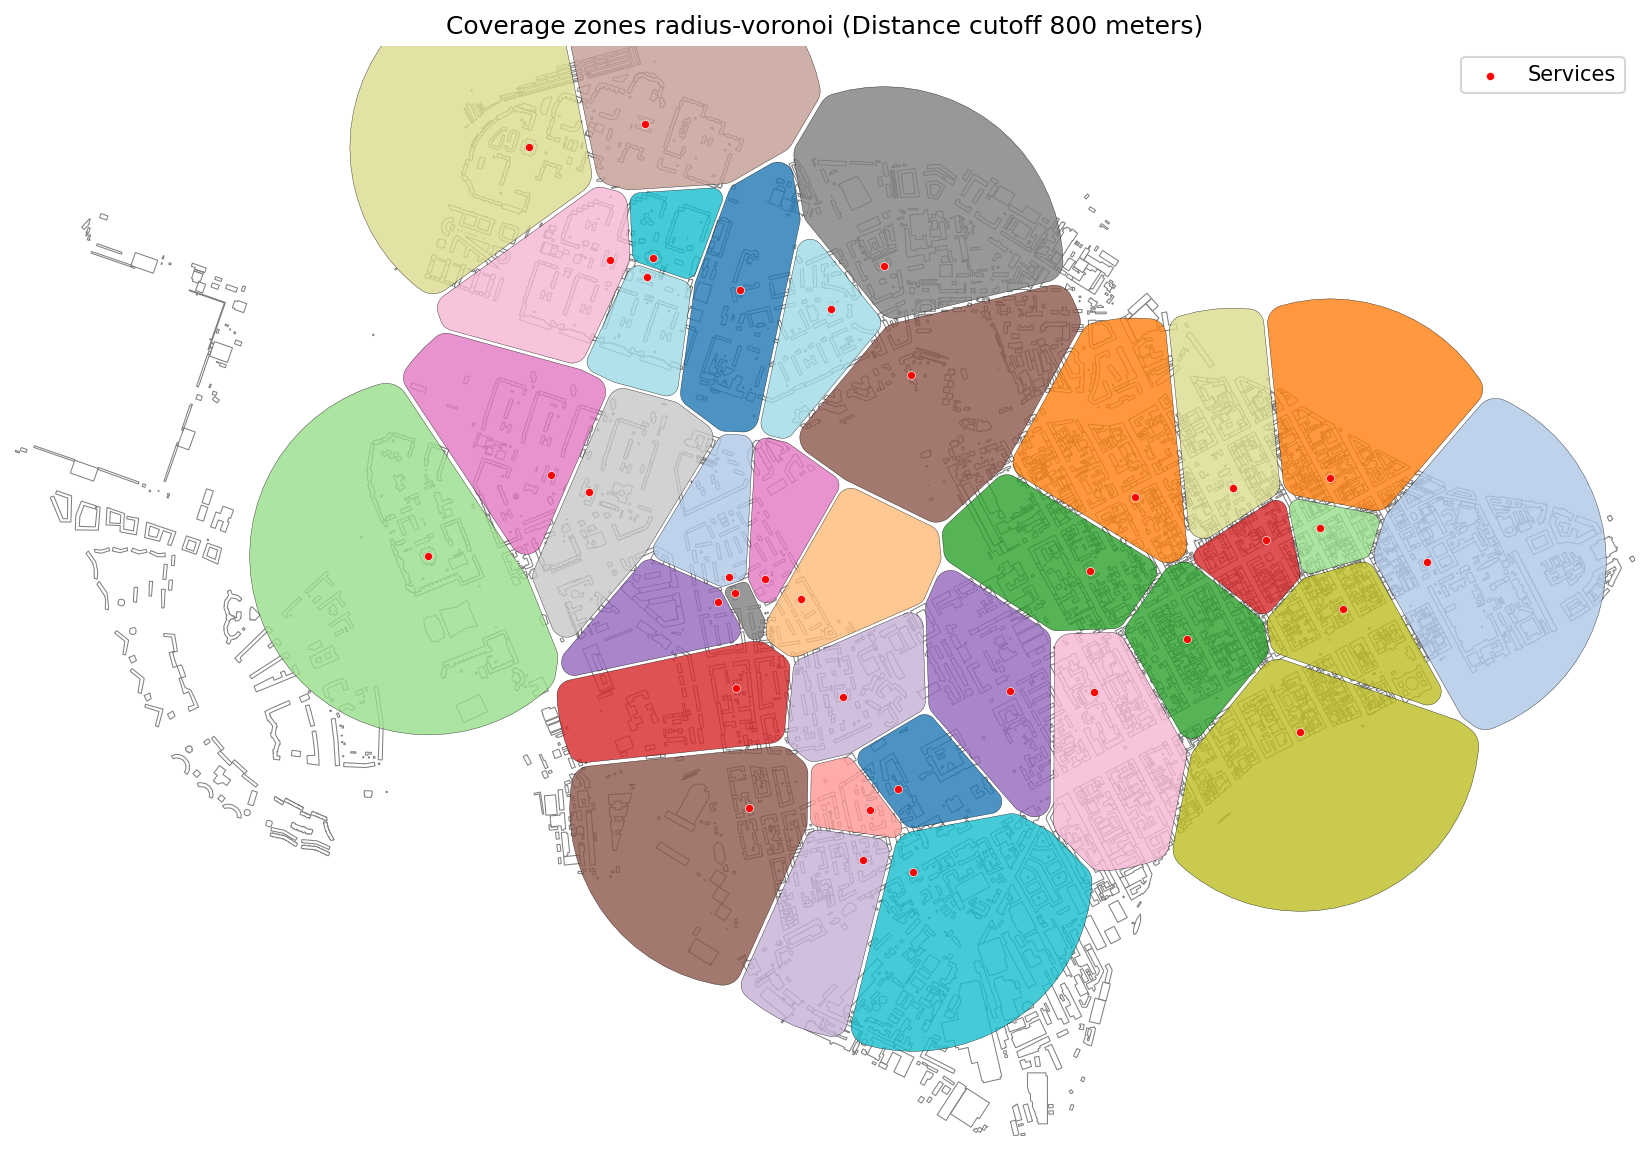
Radius-based coverage zones (800 meters) with Voronoi clipping.
Stepped Graph Coverage
Creates multi-step coverage zones (e.g., 5, 10, 15 minutes) using the full transport graph for each source point.
- objectnat.get_stepped_graph_coverage(gdf_to, nx_graph, weight_type, step_type, weight_value_cutoff=None, zone=None, step=None)[source]
Calculate stepped coverage zones from source points through a graph network using Dijkstra’s algorithm and Voronoi-based or buffer-based isochrone steps.
- This function combines graph-based accessibility with stepped isochrone logic. It:
Finds nearest graph nodes for each input point
Computes reachability for increasing weights (e.g. time or distance) in defined steps
Generates Voronoi-based or separate buffer zones around network nodes
Aggregates zones into stepped coverage layers
Optionally clips results to a boundary zone
- Parameters:
gdf_to (
geopandas.GeoDataFrame) – Source points from which stepped coverage is calculated.nx_graph (
networkx.Graph) – NetworkX graph representing the transportation network.weight_type (
Literal['time_min','length_meter']) –Type of edge weight to use for path calculation:
"time_min": Edge travel time in minutes"length_meter": Edge length in meters
step_type (
Literal['voronoi','separate']) –Method for generating stepped zones:
"voronoi": Stepped zones based on Voronoi polygons around graph nodes"separate": Independent buffer zones per step
weight_value_cutoff (
float, optional) – Maximum weight value (e.g., max travel time or distance) to limit the coverage extent.zone (
geopandas.GeoDataFrame, optional) – Optional boundary polygon to clip resulting stepped zones. If None, concave hull of reachable area is used.step (
float, optional) –Step interval for coverage zone construction. Defaults to:
100 meters for distance-based weight
1 minute for time-based weight
- Returns:
GeoDataFrame with polygons representing stepped coverage zones for each input point, annotated by step range.
- Return type:
gpd.GeoDataFrame
Notes
Input graph must have a valid CRS defined.
MultiGraph or MultiDiGraph inputs will be simplified to Graph/DiGraph.
Designed for accessibility and spatial equity analyses over multimodal networks.
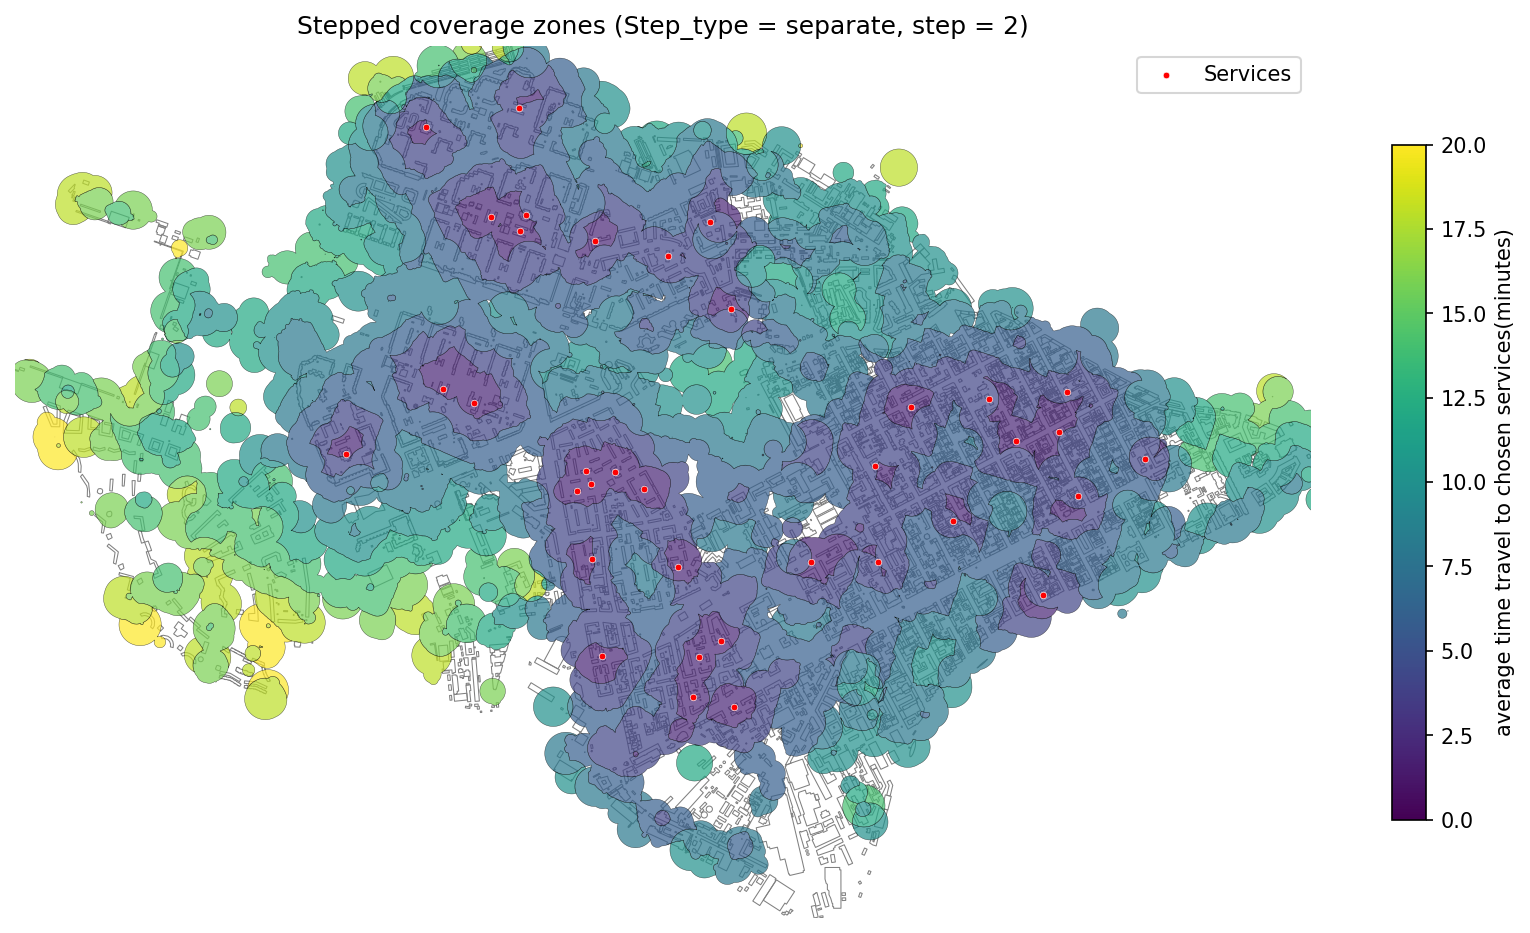
Stepped coverage zones displayed as separate intervals.
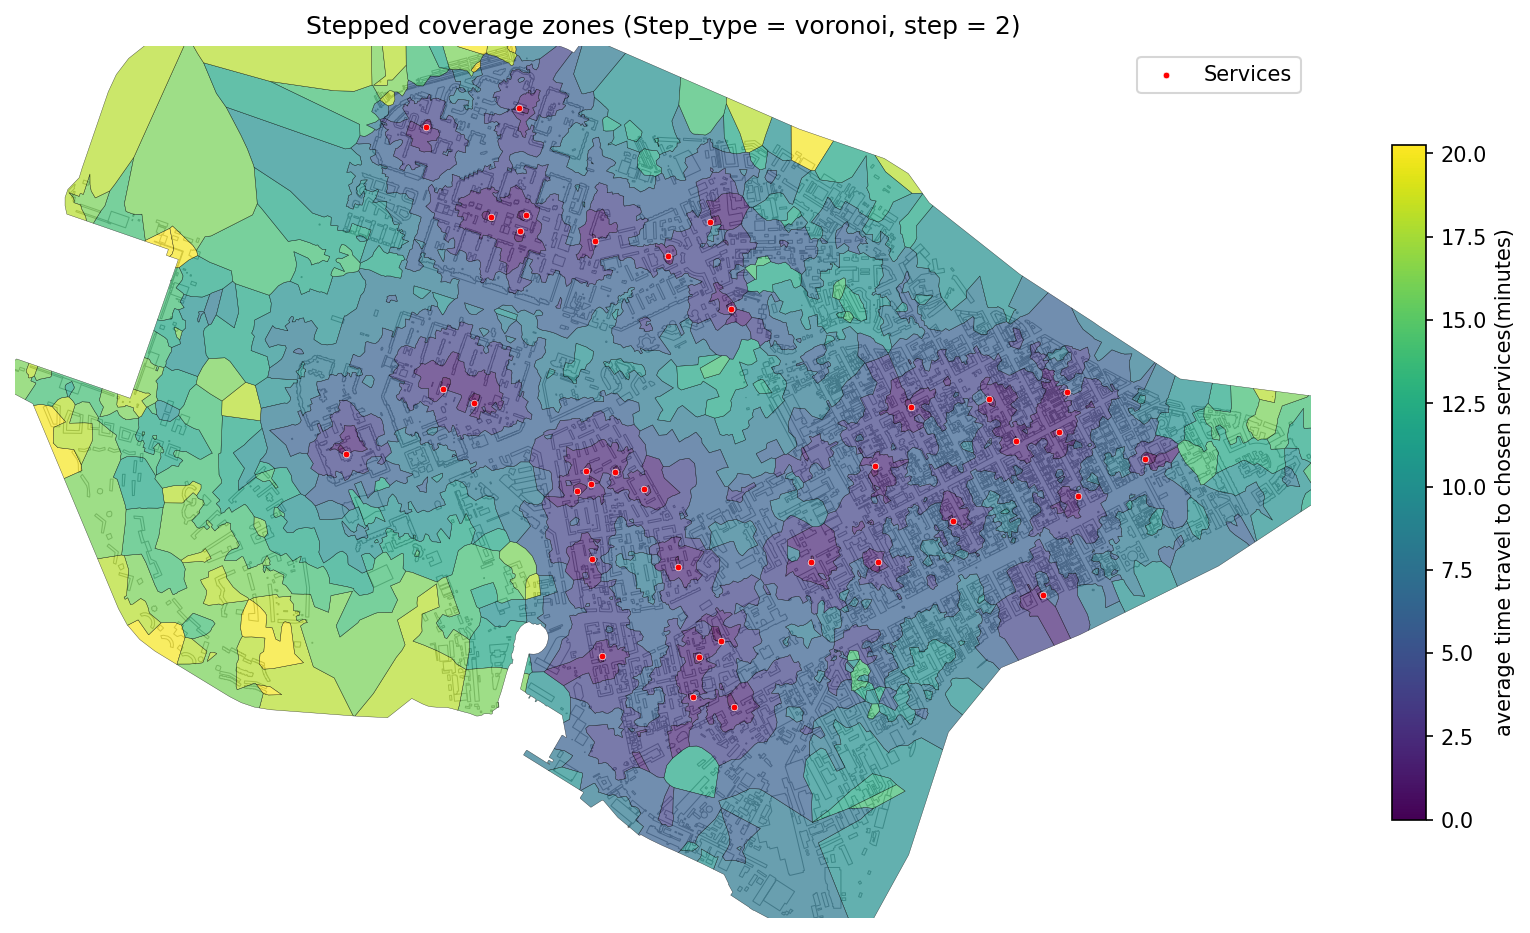
Stepped coverage zones merged using Voronoi partitioning.
Note
Coverage zones are a powerful tool for evaluating service accessibility, network efficiency, and urban reachability.