Service Provision Analysis
This module evaluates how well services (e.g., schools, clinics, shops) cover residential buildings based on their capacity and accessibility. It models demand–supply relationships and provides tools to analyze, visualize, and adjust service coverage.
Service provision analysis helps estimate how effectively urban infrastructure meets population needs.
Evaluate Initial Provision
Calculates provision scores between population points and service facilities considering:
Distance or time thresholds
Facility capacity
Demand distribution
- objectnat.get_service_provision(buildings, adjacency_matrix, services, threshold, buildings_demand_column='demand', services_capacity_column='capacity')[source]
Compute service provision between demand locations (buildings) and service facilities.
The function implements a gravity-based allocation model: service capacity is distributed across nearby demand points with weights that decay with the square of distance (or generalized cost). Closer buildings receive proportionally higher shares of the available capacity.
- Parameters:
buildings (
geopandas.GeoDataFrame) – GeoDataFrame of demand locations (e.g., residential buildings). Must include a numeric column with demand values (seebuildings_demand_column).adjacency_matrix (
pd.DataFrame) – A rectangular DataFrame representing OD (origin–destination) costs betweenbuildings(rows) andservices(columns). Units must matchthreshold(e.g., minutes or meters). Missing or infinite values (NaNorinf) are treated as unreachable. The row index must matchbuildings.indexand column index must matchservices.index.services (
geopandas.GeoDataFrame) – GeoDataFrame of service facilities (e.g., schools, clinics). Must include a numeric column with service capacity (seeservices_capacity_column).threshold (
int) – Maximum allowed cost value for assignment. Any OD entry greater than this threshold is considered unreachable. Units are the same as inadjacency_matrix.buildings_demand_column (
str) – Column name of building demand values. Default is"demand".services_capacity_column (
str) – Column name of service capacity values. Default is"capacity".
- Returns:
A tuple of three GeoDataFrames:
buildings: input buildings with updated provision metrics.
services: input services with updated load and capacity metrics.
links: building–service links within the threshold, containing allocated demand shares and distances/costs based on the gravity model.
- Return type:
Tuple[gpd.GeoDataFrame, gpd.GeoDataFrame, gpd.GeoDataFrame]
Notes
The model is gravity-based, with cost weights decaying by the square of distance.
Unreachable OD pairs (
NaNorinf) are ignored.The function does not perform routing; it expects a precomputed OD matrix.
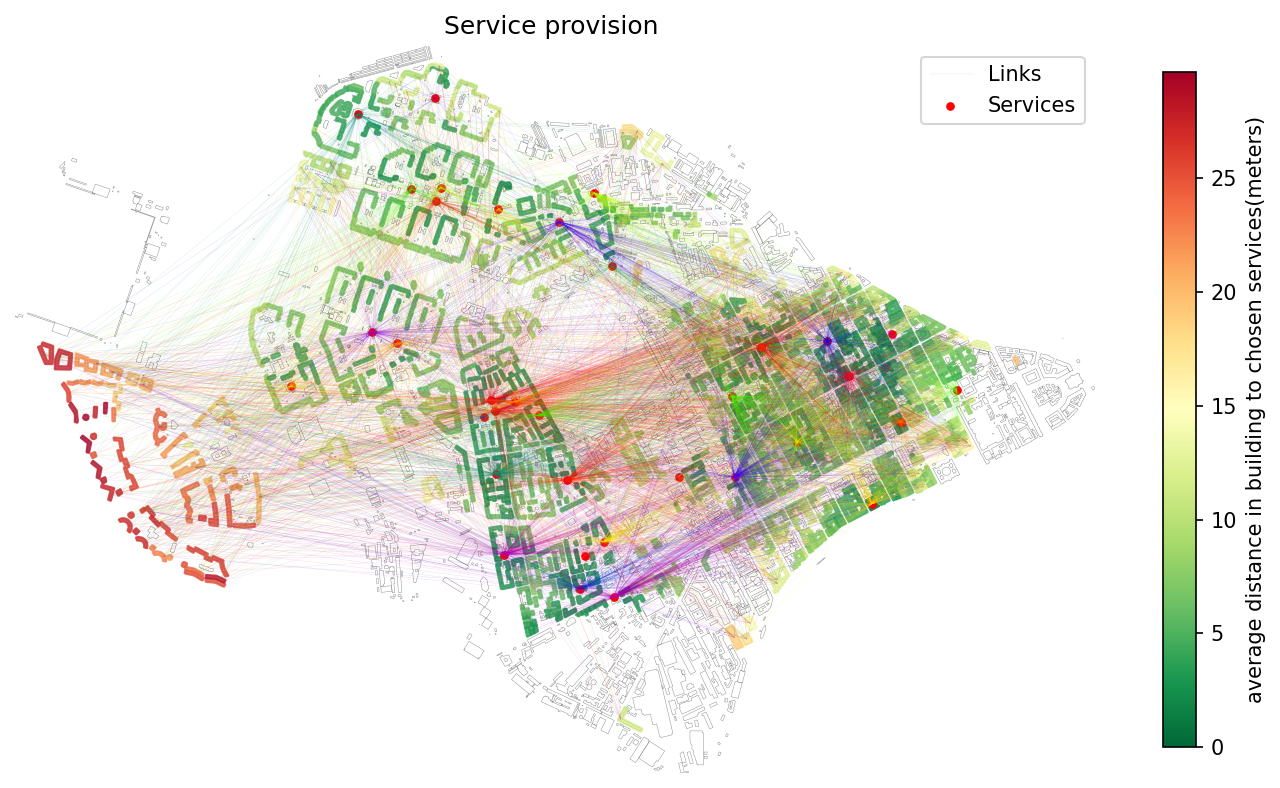
Initial service provision analysis — demand–supply balance based on accessibility.
Recalculate Provision
Allows recalculation of provision results with new accessibility thresholds without recomputing the full OD-matrix, saving computation time.
- objectnat.recalculate_links(buildings, services, links, new_max_dist)[source]
Recalculate provision aggregates after tightening the accessibility threshold.
Removes all links whose cost (distance or time) exceeds
new_max_dist, then updates demand and capacity aggregates accordingly. This is done without redistributing removed demand to alternative services.- Parameters:
buildings (
GeoDataFrame) – GeoDataFrame of buildings afterget_service_provision(). Expected to include provision-related fields such as demand, demand_left, supplied demand, and average distance/cost.services (
GeoDataFrame) – GeoDataFrame of services afterget_service_provision(), with fields describing remaining capacity and service load.links (
GeoDataFrame) –GeoDataFrame of building–service links containing at least:
building_indexservice_indexdistance(or time cost, in the same units asnew_max_dist)demand(assigned portion)
new_max_dist (
float) – New maximum allowed cost value (same units as OD/threshold). Links with cost greater than this value are removed.
- Returns:
buildings: updated aggregate demand metrics and recalculated average cost.
services: updated load and capacity fields after freeing excess capacity.
links: subset of links that remain within the new threshold.
- Return type:
tuple[gpd.GeoDataFrame, gpd.GeoDataFrame, gpd.GeoDataFrame]
Notes
If no links exceed
new_max_dist, the function logs a warning and returns the original inputs unchanged.Average cost values are recomputed based on remaining links. If a building has no remaining assigned demand,
avg_distbecomesNaN.Removed demand is not reallocated to other services.
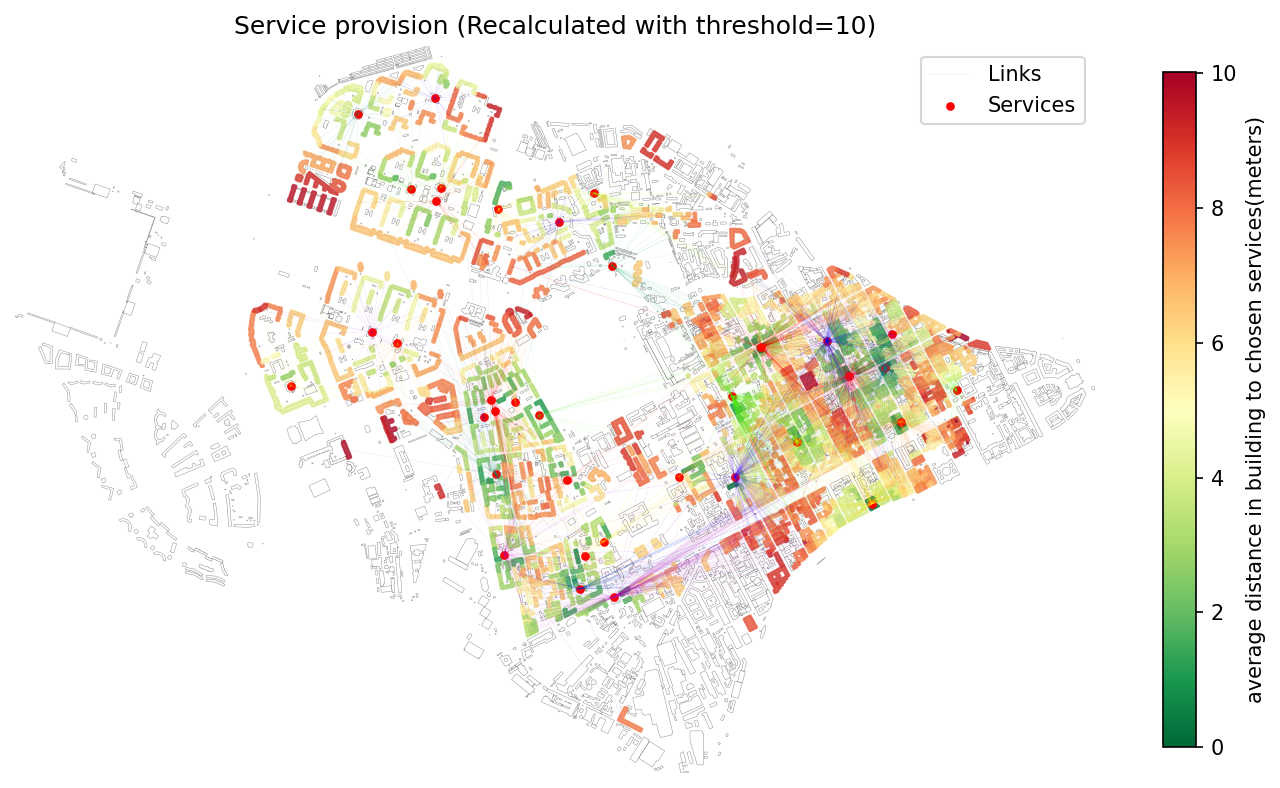
Recalculated provision results using adjusted travel-time thresholds.
Clip to Analysis Area
Restricts provision outputs to a given geographic boundary (e.g., administrative region, neighborhood, planning area).
- objectnat.clip_provision(buildings, services, links, selection_zone)[source]
Clip service provision results to a specific geographic boundary.
- Keeps only:
buildings that intersect the
selection_zone;links that connect to the kept buildings;
services referenced by those links.
- Parameters:
buildings (
GeoDataFrame) – GeoDataFrame of buildings afterget_service_provision().services (
GeoDataFrame) – GeoDataFrame of services afterget_service_provision().links (
GeoDataFrame) – GeoDataFrame of building–service links fromget_service_provision(). Must include indices or columns to match buildings and services.selection_zone (
GeoDataFrame) – GeoDataFrame (polygon or multipolygon) defining the clipping area.
- Returns:
The filtered subsets of buildings, services, and links that fall inside the specified zone.
- Return type:
Tuple[gpd.GeoDataFrame, gpd.GeoDataFrame, gpd.GeoDataFrame]
Notes
The function performs spatial filtering only. It does not recompute or redistribute demand/supply.
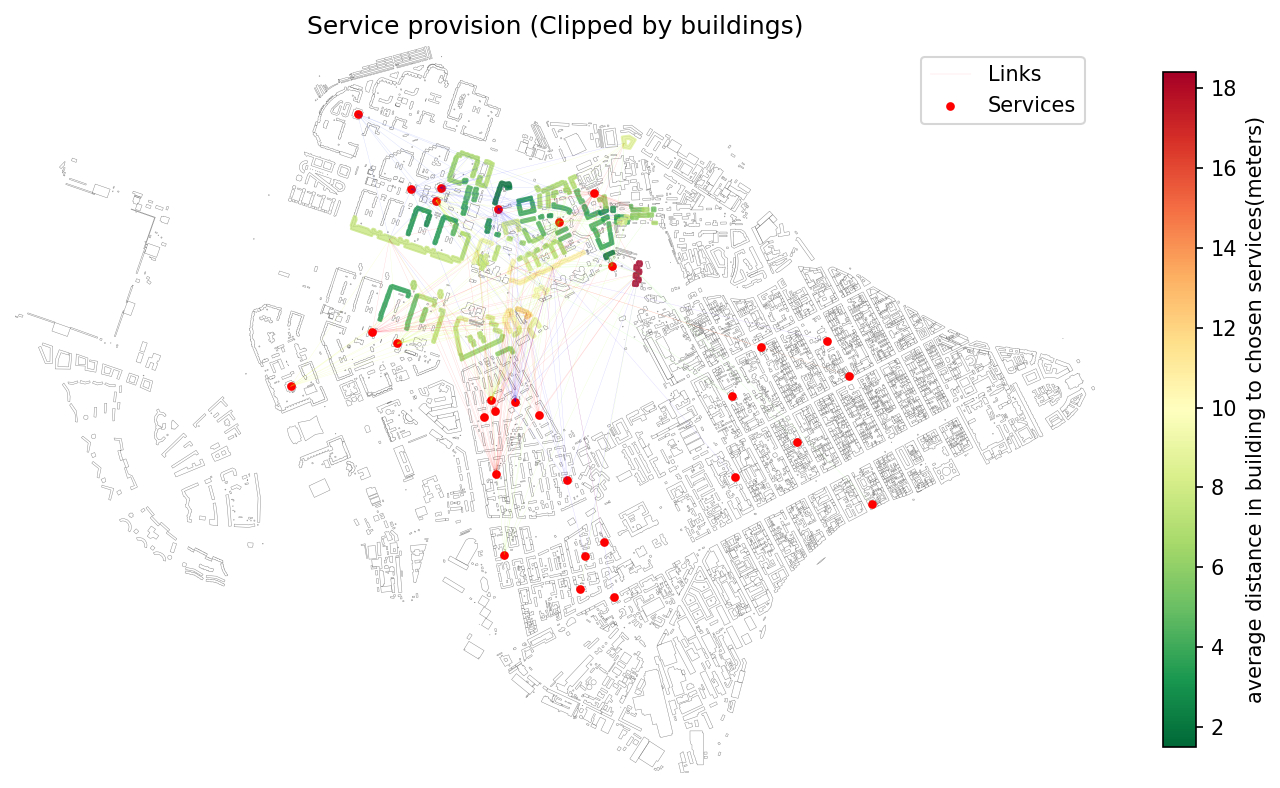
Provision results clipped to a selected administrative boundary.
Example notebook
Building-to-Service Travel Time Matrix with Intermodal Graph Service Provision Analysis