Benchmarks and Design Notes
IduEdu is designed as a single Python pipeline for city-network analysis: OpenStreetMap extraction,
graph construction, public-transport integration and large origin-destination computations all use the
same UrbanGraph data model. The 2026 paper benchmark suite in paper2026/ measures those stages from
raw CSV outputs, with repeated runs and median values.
The numbers below are not a general ranking of geospatial libraries. OSMnx remains a mature and widely
used toolkit for street-network analysis. This comparison isolates one common workload: pedestrian graph
construction from the same city-scale AOIs, using both simplify=False and simplify=True in IduEdu and
OSMnx.
What IduEdu Adds
UrbanGraph: a tabular graph representation backed byGeoDataFramenode and edge tables.Lazy CSR adjacency built directly from edge tables and reused by shortest-path routines.
Street-graph builders for drive and walk networks from OSM with metric projection and optional simplification.
Static public-transport graph construction directly from OSM relations, without requiring GTFS. A separate GTFS builder is available, but it is not part of the reported benchmark workload.
Intermodal graph construction by projecting stops, platforms and subway access points onto the walking graph.
OD-matrix computation on Numba-backed CSR kernels with cutoff thresholds and adaptive graph reversal.
Optional NetworkX adapters for interoperability without using NetworkX as the internal graph representation.
Pedestrian Graph Construction
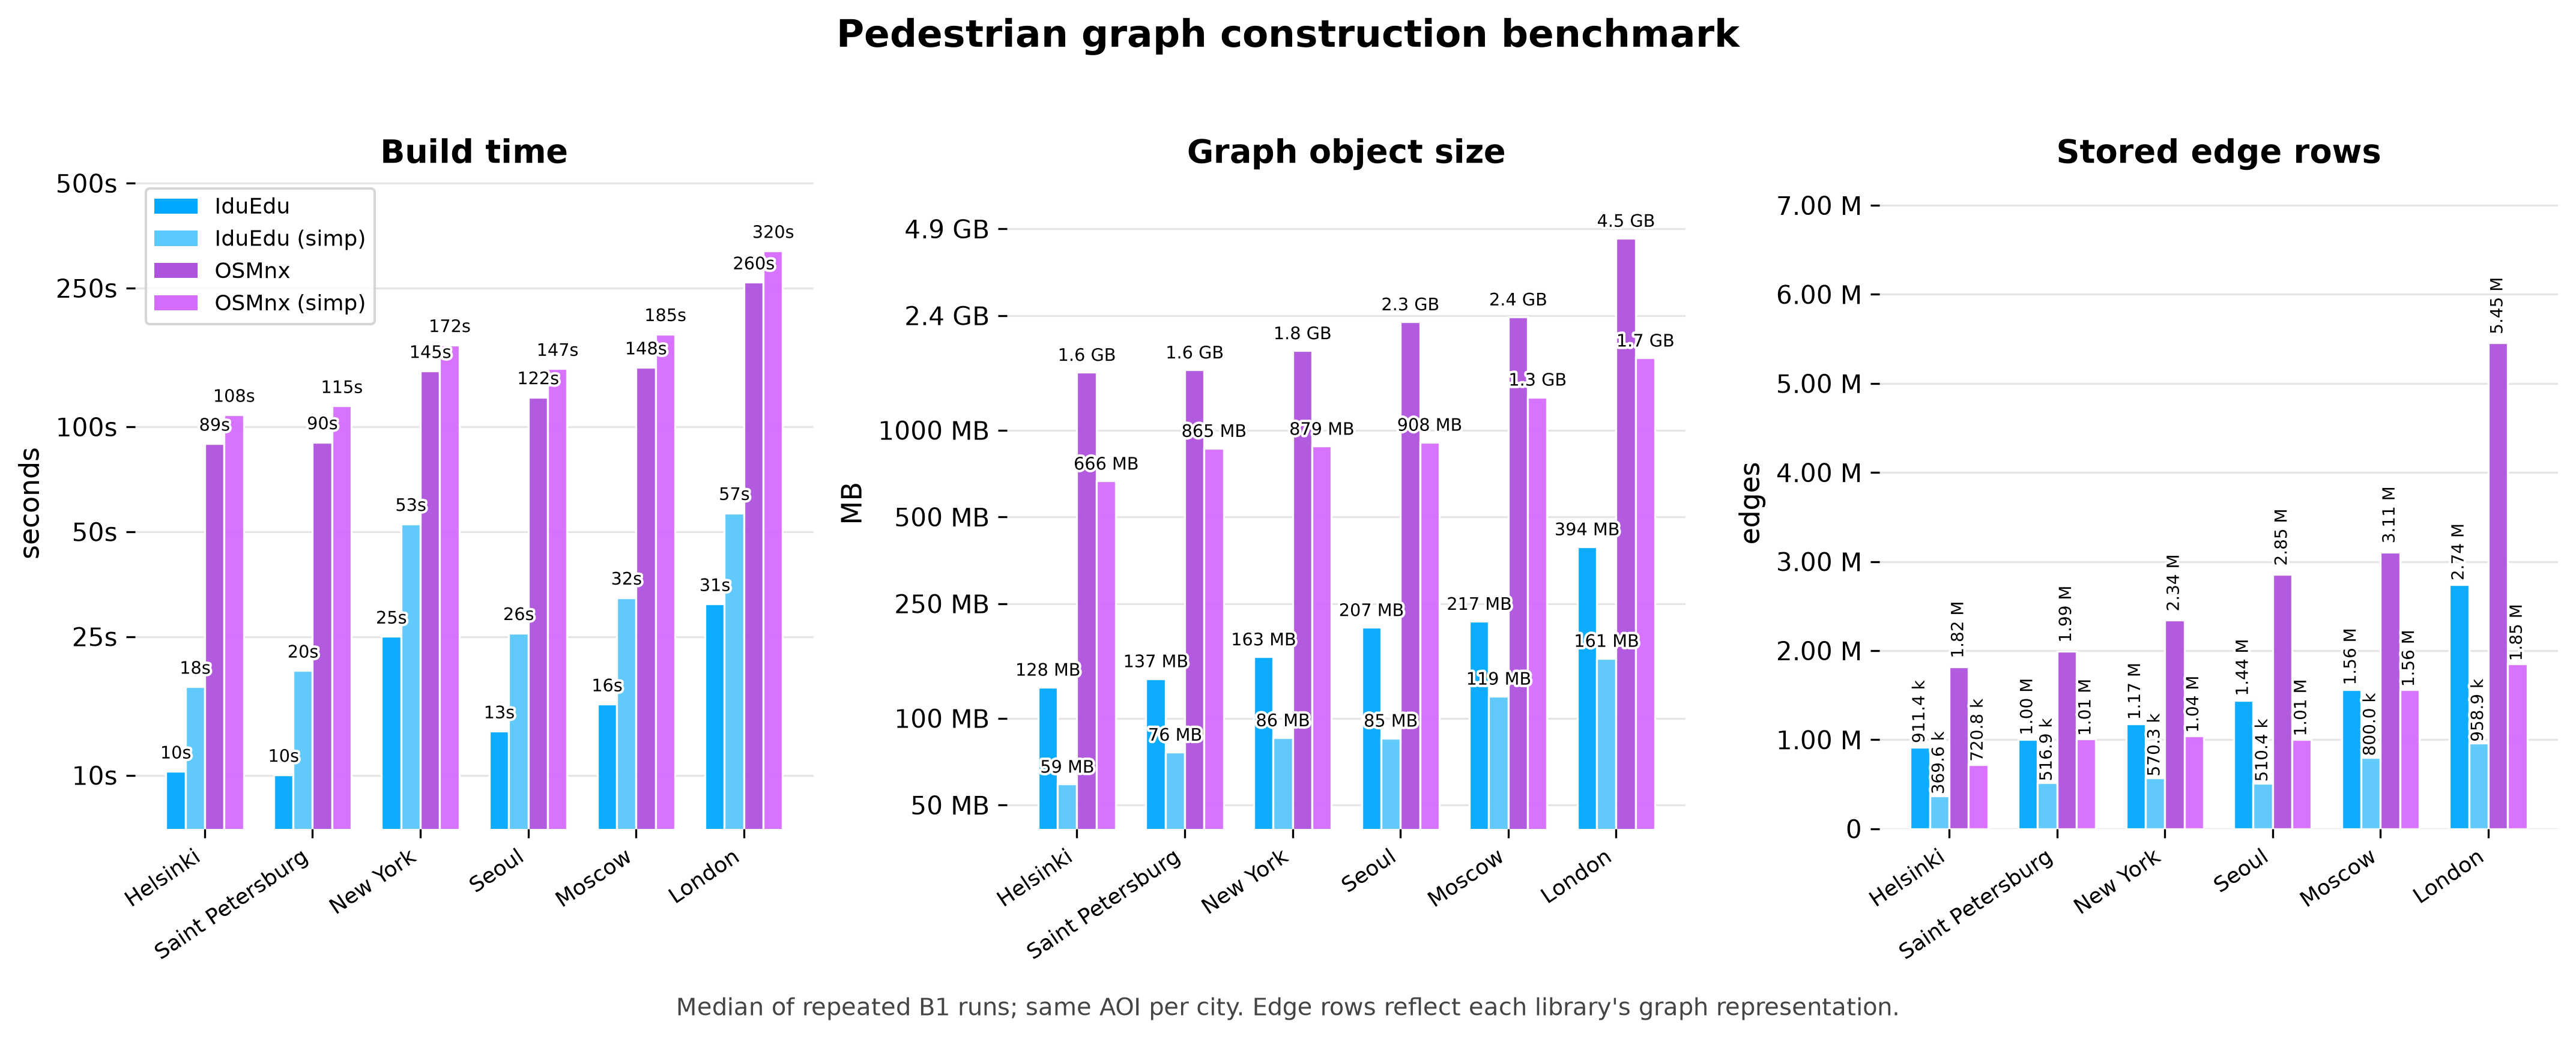
Benchmark B1 compares graph construction time, stored edge rows and a deterministic object-size estimate
for the final in-memory geospatial graph representation. For IduEdu, the estimate covers UrbanGraph
node and edge GeoDataFrame tables plus Shapely geometry coordinate buffers. For OSMnx, the estimate
covers the returned networkx.MultiDiGraph dictionaries, attributes, geometry and coordinate buffers.
It is not peak process RSS during construction.
Without simplification, IduEdu’s time ratio is highest in this workload: OSMnx takes 6.6-10.0x longer across the tested cities, with a median ratio of 9.7x. With simplification enabled, the ratio is 3.9-6.7x with a median of 6.5x. In both modes, the final graph representation has a roughly 10-12x lower deterministic object-size estimate.
Rows are lightly shaded by simplify mode. Ratios are OSMnx / IduEdu.
| Simplify | City | Build time | Graph object size | Stored edge rows | |||||
|---|---|---|---|---|---|---|---|---|---|
| IduEdu | OSMnx | Ratio | IduEdu | OSMnx | Ratio | IduEdu | OSMnx | ||
| false | Helsinki | 11.0 s | 104.8 s | 9.5x | 129 MB | 1.6 GB | 12.4x | 913.9k | 1.82M |
| Saint Petersburg | 10.3 s | 100.1 s | 9.7x | 138 MB | 1.6 GB | 11.8x | 1.01M | 2.01M | |
| New York | 24.6 s | 162.8 s | 6.6x | 164 MB | 1.8 GB | 11.6x | 1.18M | 2.35M | |
| Seoul | 13.5 s | 134.9 s | 10.0x | 209 MB | 2.3 GB | 11.5x | 1.46M | 2.89M | |
| Moscow | 16.1 s | 159.0 s | 9.9x | 218 MB | 2.4 GB | 11.4x | 1.57M | 3.12M | |
| London | 30.2 s | 290.5 s | 9.6x | 394 MB | 4.5 GB | 11.8x | 2.74M | 5.45M | |
| true | Helsinki | 19.9 s | 131.6 s | 6.6x | 59 MB | 669 MB | 11.3x | 370.9k | 723.1k |
| Saint Petersburg | 20.3 s | 133.2 s | 6.5x | 77 MB | 873 MB | 11.3x | 522.1k | 1.02M | |
| New York | 48.5 s | 189.7 s | 3.9x | 86 MB | 881 MB | 10.3x | 571.3k | 1.05M | |
| Seoul | 24.3 s | 158.9 s | 6.6x | 86 MB | 915 MB | 10.6x | 514.3k | 1.01M | |
| Moscow | 32.8 s | 203.8 s | 6.2x | 120 MB | 1.3 GB | 10.9x | 804.1k | 1.57M | |
| London | 52.0 s | 348.9 s | 6.7x | 161 MB | 1.7 GB | 11.0x | 956.5k | 1.85M | |
Edge counts should be read as stored edge rows in each representation, not as an independent quality
metric. UrbanGraph can encode bidirectional pedestrian edges with one row and an edge-direction column,
while a directed multigraph representation commonly stores separate directed edge rows.
Protocol
All B1 measurements use the same area of interest per city. The benchmark suite downloads PBF files, extracts the PBF bounding box and uses that bounding box as the AOI for each library. Every measurement is repeated at least three times, and the documentation reports medians.
Environment recorded for the B1 run:
CPU class: Intel Core i7-12700F workstation, 64 GB RAM.
Platform: Windows 10 / Windows 11 family.
Python: 3.11.9.
IduEdu: 2.0.0.
OSMnx: 2.1.1.
NetworkX: 3.6.1.
GeoPandas: 1.1.4.
Shapely: 2.1.2.
Raw results and environment captures are stored in:
paper2026/results/build_benchmark.csvpaper2026/results/intermodal_benchmark.csvpaper2026/results/od_benchmark.csvpaper2026/results/env_build.json
OD Matrices
IduEdu computes OD matrices directly on the graph representation produced by its builders. The CSR
adjacency is built from UrbanGraph.edges_gdf, cached, and passed to Numba kernels without converting the
graph into another library’s format.
Two mechanisms are important for accessibility workloads:
Cutoff thresholds stop Dijkstra expansion once the travel-time or distance threshold is exceeded.
Adaptive graph reversal swaps origins and destinations on the transposed graph when
|origins|is much larger than|destinations|, reducing the number of shortest-path launches.
The paper benchmark validates OD results against NetworkX on an identical graph: reachability sets match,
and the maximum finite difference is about 3e-4 minutes, explained by float32 arithmetic in the
accelerated kernel versus the float64 reference.
Limitations
The public-transport graph used in these benchmarks is static and OSM-based. It does not model schedules, headways or time-dependent waiting. The optional GTFS builder estimates static boarding waits from a selected schedule window, but it is still not an exact time-dependent timetable router.
The benchmark advantages are strongest for large city graphs and batch computations such as OD matrices, many-source accessibility and repeated spatial analysis. For one-off route queries, specialized routing engines can still be the right tool, especially when schedule-aware or turn-cost routing is required.