Shortest paths and OD matrices
This notebook covers distance matrices and ordered node routes available for UrbanGraph. Distances are returned in the units of the selected edge weight: minutes for time_min and meters for length_meter. Route paths can be converted to their actual graph-edge geometries for visualization.
# To install IduEdu in a clean environment:
# !pip install IduEdu

OSM_ID = 1114252
from iduedu import get_intermodal_graph

G_intermodal = get_intermodal_graph(osm_id=OSM_ID, clip_by_territory=True)
G_intermodal.update_adjacency_matrix(weight="time_min")

sample_nodes = G_intermodal.nodes_gdf.index[:6].tolist()
source = sample_nodes[0]
destinations = sample_nodes[1:]
print(sample_nodes)
2026-09-15 13:35:28.374 | WARNING | Removing 334 nodes outside the largest strongly connected component. Retaining 21184 of 21518 nodes.
2026-09-15 13:35:28.400 | WARNING | Public transport nodes dropped with the smaller components: {'trolleybus': 2}
[0, 1, 2, 3, 4, 5]
One shortest route and its geometry
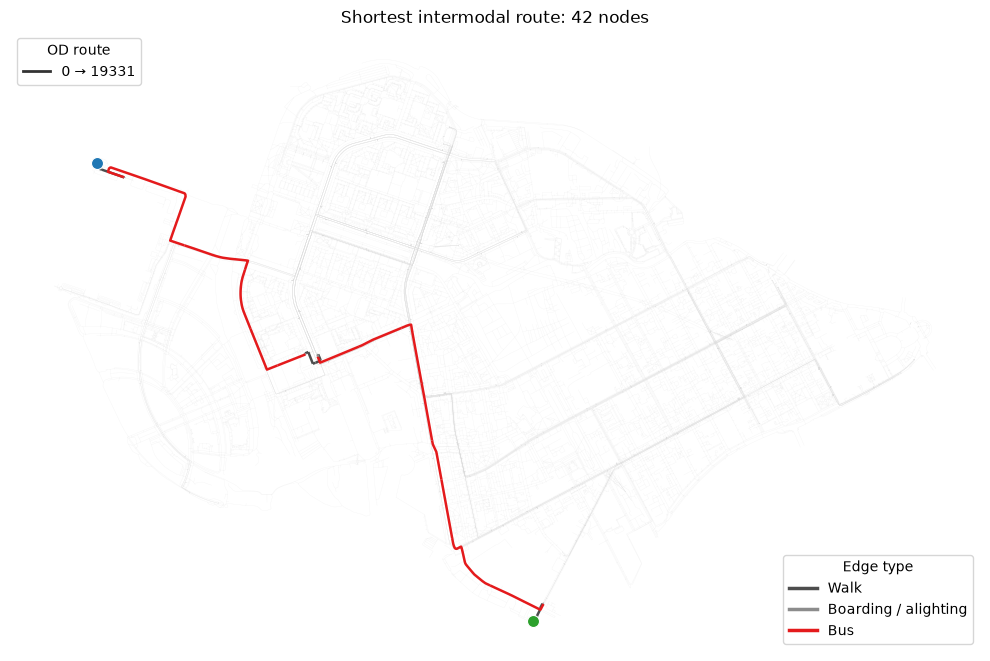
single_source_dijkstra_path returns graph node ids in traversal order. path_to_edges selects the corresponding edge geometries, including curved street and public-transport segments, and keeps edge attributes such as travel time and transport type. Edge color identifies the transport type; line style identifies the origin-destination route.
import matplotlib.pyplot as plt
from matplotlib.lines import Line2D

from iduedu import path_to_edges, single_source_dijkstra_path

# Choose a distant graph node so that the resulting route is clearly visible.
source_geometry = G_intermodal.nodes_gdf.loc[source].geometry
route_target = G_intermodal.nodes_gdf.geometry.distance(source_geometry).idxmax()
node_path = single_source_dijkstra_path(
    G_intermodal,
    source,
    route_target,
    weight="time_min",
)
route_edges = path_to_edges(G_intermodal, node_path, weight="time_min")

EDGE_COLORS = {
    "walk": ("Walk", "#4d4d4d"),
    "bus": ("Bus", "#e41a1c"),
    "trolleybus": ("Trolleybus", "#984ea3"),
    "tram": ("Tram", "#ff7f00"),
    "subway": ("Subway", "#377eb8"),
    "boarding": ("Boarding / alighting", "#8c8c8c"),
    "alighting": ("Boarding / alighting", "#8c8c8c"),
    "subway_station": ("Boarding / alighting", "#8c8c8c"),
}
ROUTE_LINESTYLES = ["-", (0, (7, 3)), (0, (1, 2)), (0, (5, 2, 1, 2))]


def plot_route_by_edge_type(ax, edges, *, linestyle="-", linewidth=1.7, zorder=3):
    """Plot one OD route using edge color for mode and line style for route."""
    used_colors = {}
    for edge_type, edge_group in edges.groupby("type", sort=False, dropna=False):
        label, color = EDGE_COLORS.get(edge_type, ("Other", "#bdbdbd"))
        edge_group.plot(
            ax=ax,
            color=color,
            linewidth=linewidth,
            linestyle=linestyle,
            zorder=zorder,
        )
        used_colors[label] = color
    return used_colors


fig, ax = plt.subplots(figsize=(10, 8))
G_intermodal.edges_gdf.plot(ax=ax, color="#dddddd", linewidth=0.2, alpha=0.4, zorder=1)
used_colors = plot_route_by_edge_type(ax, route_edges, linewidth=1.8)
G_intermodal.nodes_gdf.loc[[source]].plot(
    ax=ax, color="#2ca02c", edgecolor="white", linewidth=0.8, markersize=75, zorder=5
)
G_intermodal.nodes_gdf.loc[[route_target]].plot(
    ax=ax, color="#1f77b4", edgecolor="white", linewidth=0.8, markersize=75, zorder=5
)

route_handle = Line2D([0], [0], color="#333333", linewidth=2, linestyle="-", label=f"{source} → {route_target}")
mode_handles = [
    Line2D([0], [0], color=color, linewidth=2.5, linestyle="-", label=label)
    for label, color in used_colors.items()
]
route_legend = ax.legend(handles=[route_handle], title="OD route", loc="upper left")
ax.add_artist(route_legend)
ax.legend(handles=mode_handles, title="Edge type", loc="lower right")
ax.set_title(f"Shortest intermodal route: {len(node_path)} nodes")
ax.set_axis_off()
fig.tight_layout()
Path matrices: all-to-all and pairwise
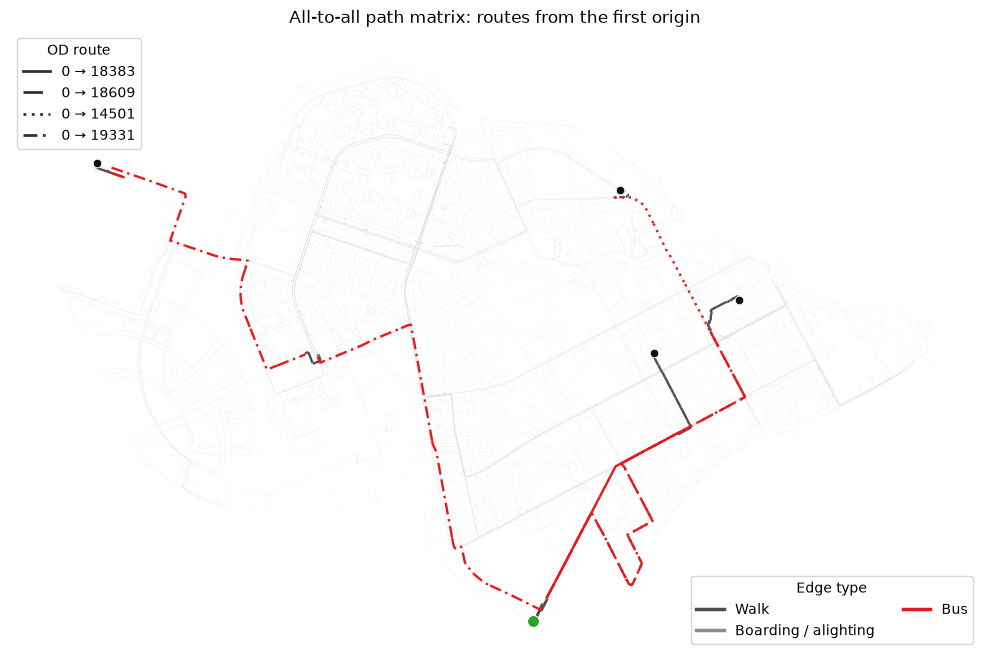
multi_source_dijkstra_path accepts the same node-list or GeoDataFrame inputs as od_matrix. In all_to_all mode every matrix cell contains an ordered node route. In pairwise mode origin i is matched only with destination i.
from iduedu import multi_source_dijkstra_path

distance_rank = G_intermodal.nodes_gdf.geometry.distance(source_geometry).sort_values()
rank_positions = [len(distance_rank) // 4, len(distance_rank) // 2, 3 * len(distance_rank) // 4, -1]
matrix_origins = [source, distance_rank.index[len(distance_rank) // 10]]
matrix_destinations = distance_rank.iloc[rank_positions].index.tolist()

path_matrix = multi_source_dijkstra_path(
    G_intermodal,
    origins_nodes=matrix_origins,
    destination_nodes=matrix_destinations,
    mode="all_to_all",
    max_workers=4,
)

pairwise_paths = multi_source_dijkstra_path(
    G_intermodal,
    origins_nodes=matrix_origins,
    destination_nodes=matrix_destinations[:2],
    mode="pairwise",
    max_workers=4,
)

path_matrix
| 18383 | 18609 | 14501 | 19331 | |
|---|---|---|---|---|
| 0 | [0, 17257, 1, 3, 2, 5, 26, 27, 20146, 20403, 2... | [0, 17257, 1, 3, 2, 5, 26, 27, 20146, 20403, 2... | [0, 17257, 1, 3, 2, 5, 26, 27, 20146, 20403, 2... | [0, 17257, 1, 7, 23, 25, 20145, 20402, 20630, ... |
| 1622 | [1622, 1632, 1633, 2710, 2721, 2723, 2704, 272... | [1622, 1618, 1649, 1620, 20238, 20939, 20952, ... | [1622, 1618, 1649, 1620, 20238, 20937, 20950, ... | [1622, 1618, 1617, 1616, 1568, 1583, 1566, 156... |
Visualize several matrix routes
Each non-empty matrix cell can be passed directly to path_to_edges. The plot below overlays all routes from the first origin to the selected destinations. Colors distinguish transport types, while solid and dashed patterns distinguish OD routes.
fig, ax = plt.subplots(figsize=(10, 8))
G_intermodal.edges_gdf.plot(ax=ax, color="#dddddd", linewidth=0.2, alpha=0.35, zorder=1)

first_origin = path_matrix.index[0]
route_handles = []
all_used_colors = {}
for linestyle, destination in zip(ROUTE_LINESTYLES, path_matrix.columns):
    path = path_matrix.loc[first_origin, destination]
    if isinstance(path, list):
        edges = path_to_edges(G_intermodal, path)
        all_used_colors.update(plot_route_by_edge_type(ax, edges, linestyle=linestyle, linewidth=1.7))
        route_handles.append(
            Line2D(
                [0], [0], color="#333333", linewidth=2, linestyle=linestyle, label=f"{first_origin} → {destination}"
            )
        )

G_intermodal.nodes_gdf.loc[[first_origin]].plot(
    ax=ax, color="#2ca02c", edgecolor="white", linewidth=0.8, markersize=75, zorder=5
)
G_intermodal.nodes_gdf.loc[path_matrix.columns].plot(
    ax=ax, color="#111111", edgecolor="white", linewidth=0.6, markersize=38, zorder=5
)
mode_handles = [
    Line2D([0], [0], color=color, linewidth=2.5, linestyle="-", label=label)
    for label, color in all_used_colors.items()
]
route_legend = ax.legend(handles=route_handles, title="OD route", loc="upper left")
ax.add_artist(route_legend)
ax.legend(handles=mode_handles, title="Edge type", loc="lower right", ncol=2)
ax.set_title("All-to-all path matrix: routes from the first origin")
ax.set_axis_off()
fig.tight_layout()
Single-source distances
Use this for one origin and many possible destinations, for example an intermodal travel-time catchment around one point.
from iduedu import single_source_dijkstra_path_length

single = single_source_dijkstra_path_length(
    G_intermodal,
    source,
    weight="time_min",
    cutoff=15,
)

single.sort_values().head(10)
node
0          0.0
17257    0.151
8        0.612
9        0.972
1        1.413
3        1.472
7         1.48
6        1.491
10       1.523
2        1.549
Name: dist, dtype: Sparse[float32, inf]
Multi-source distance to the closest source
All sources are inserted into one Dijkstra queue. The result gives the distance to the nearest source, not one row per source.
from iduedu import multi_source_dijkstra_path_length

multi = multi_source_dijkstra_path_length(
    G_intermodal,
    source_nodes=sample_nodes[:3],
    weight="time_min",
    cutoff=15,
)

multi.sort_values().head(10)
node
0          0.0
2          0.0
1          0.0
3        0.059
7        0.067
6        0.078
5        0.144
17257    0.151
26       0.213
23       0.217
Name: dist, dtype: Sparse[float32, inf]
Nearest source label and distance
Use this when the winning source node is needed along with the shortest distance.
from iduedu import multi_source_dijkstra_nearest_source

nearest = multi_source_dijkstra_nearest_source(
    G_intermodal,
    source_nodes=sample_nodes[:3],
    weight="time_min",
    cutoff=15,
)

nearest.head(10)
| source_node | dist | |
|---|---|---|
| node | ||
| 0 | 0 | 0.0 |
| 1 | 1 | 0.0 |
| 2 | 2 | 0.0 |
| 3 | 1 | 0.059 |
| 4 | 2 | 1.61 |
| 5 | 2 | 0.144 |
| 6 | 1 | 0.078 |
| 7 | 1 | 0.067 |
| 8 | 0 | 0.612 |
| 9 | 0 | 0.972 |
Independent parallel searches
dijkstra_path_length_parallel keeps one sparse row per source. This is useful when each origin needs its own accessibility profile.
from iduedu import dijkstra_path_length_parallel

parallel = dijkstra_path_length_parallel(
    G_intermodal,
    source_nodes=sample_nodes[:3],
    weight="time_min",
    cutoff=15,
    max_workers=4,
)

parallel.iloc[:, :8]
| node | 0 | 1 | 2 | 3 | 4 | 5 | 6 | 7 |
|---|---|---|---|---|---|---|---|---|
| 0 | 0.0 | 1.413 | 1.549 | 1.472 | 3.159 | 1.693 | 1.491 | 1.48 |
| 1 | 1.413 | 0.0 | 0.136 | 0.059 | 1.746 | 0.28 | 0.078 | 0.067 |
| 2 | 1.549 | 0.136 | 0.0 | 0.077 | 1.61 | 0.144 | 0.153 | 0.203 |
Origin-destination matrix
od_matrix accepts graph node ids or GeoDataFrames. With node ids, rows follow origins_nodes and columns follow destination_nodes.
from iduedu import od_matrix

od = od_matrix(
    G_intermodal,
    origins_nodes=sample_nodes[:3],
    destination_nodes=destinations,
    weight="time_min",
    threshold=30,
    max_workers=4,
)

od
| 1 | 2 | 3 | 4 | 5 | |
|---|---|---|---|---|---|
| 0 | 1.413 | 1.549 | 1.472 | 3.159 | 1.693 |
| 1 | 0.0 | 0.136 | 0.059 | 1.746 | 0.28 |
| 2 | 0.136 | 0.0 | 0.077 | 1.61 | 0.144 |
Method equivalents
The same helpers are also available as UrbanGraph methods.
G_intermodal.single_source_dijkstra_path(source, destinations[0], cutoff=15)
G_intermodal.multi_source_dijkstra_path(origins_nodes=sample_nodes[:2], destination_nodes=destinations, threshold=30)
G_intermodal.path_to_edges(node_path).head()
G_intermodal.single_source_dijkstra_path_length(source, cutoff=15).head()
G_intermodal.multi_source_dijkstra_path_length(source_nodes=sample_nodes[:3], cutoff=15).head()
G_intermodal.multi_source_dijkstra_nearest_source(source_nodes=sample_nodes[:3], cutoff=15).head()
G_intermodal.dijkstra_path_length_parallel(source_nodes=sample_nodes[:3], cutoff=15, max_workers=4).iloc[:, :5]
G_intermodal.od_matrix(origins_nodes=sample_nodes[:3], destination_nodes=destinations, threshold=30)
| 1 | 2 | 3 | 4 | 5 | |
|---|---|---|---|---|---|
| 0 | 1.413 | 1.549 | 1.472 | 3.159 | 1.693 |
| 1 | 0.0 | 0.136 | 0.059 | 1.746 | 0.28 |
| 2 | 0.136 | 0.0 | 0.077 | 1.61 | 0.144 |