Service Provision Analysis
This module evaluates how well services (e.g., schools, clinics) cover residential buildings based on their capacity and accessibility.
It models demand-supply relationships and provides tools to analyze and adjust service coverage.
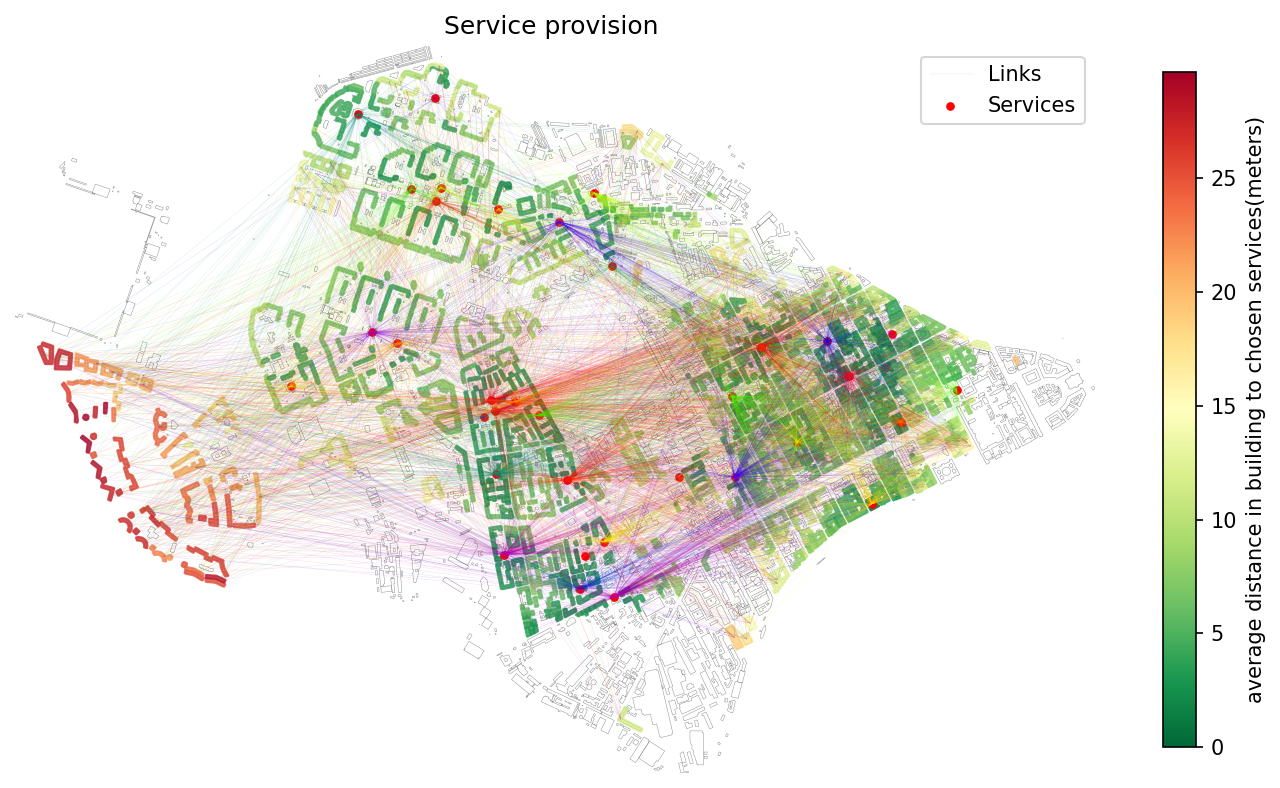
Evaluate initial provision
Calculates provision scores between population points and service facilities considering:
- Distance or time threshold,
- Facility capacity,
- Demand distribution.
objectnat.get_service_provision(buildings, adjacency_matrix, services, threshold, buildings_demand_column='demand', services_capacity_column='capacity')
¶Calculate load from buildings with demands on the given services using the distances matrix between them.
Parameters:
| Name | Type | Description | Default |
|---|---|---|---|
services
|
GeoDataFrame
|
GeoDataFrame of services |
required |
adjacency_matrix
|
DataFrame
|
DataFrame representing the adjacency matrix |
required |
buildings
|
GeoDataFrame
|
GeoDataFrame of demanded buildings |
required |
threshold
|
int
|
Threshold value |
required |
buildings_demand_column
|
str
|
column name of buildings demands |
'demand'
|
services_capacity_column
|
str
|
column name of services capacity |
'capacity'
|
Returns:
| Type | Description |
|---|---|
Tuple[GeoDataFrame, GeoDataFrame, GeoDataFrame]
|
Tuple of GeoDataFrames representing provision |
GeoDataFrame
|
buildings, provision services, and provision links |
Source code in src\objectnat\methods\provision\provision.py
14 15 16 17 18 19 20 21 22 23 24 25 26 27 28 29 30 31 32 33 34 35 36 37 38 39 40 41 42 43 44 45 46 47 48 49 50 51 52 53 54 | |
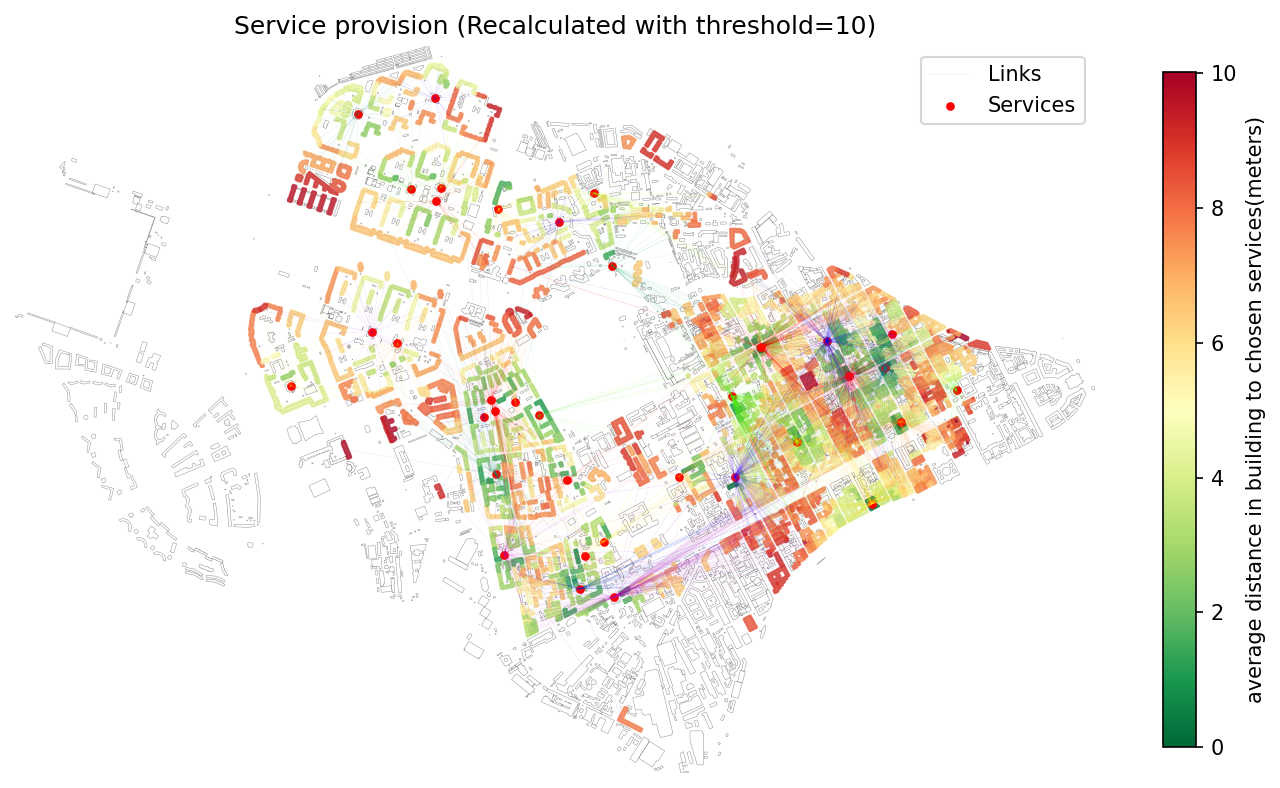
Recalculate provision
Allows you to recalculate provision results with new accessibility thresholds without recomputing the full OD-matrix.
objectnat.recalculate_links(buildings, services, links, new_max_dist)
¶Source code in src\objectnat\methods\provision\provision.py
79 80 81 82 83 84 85 86 87 88 89 90 91 92 93 94 95 96 97 98 99 100 101 102 103 104 105 106 107 108 109 110 111 112 113 114 115 116 117 | |
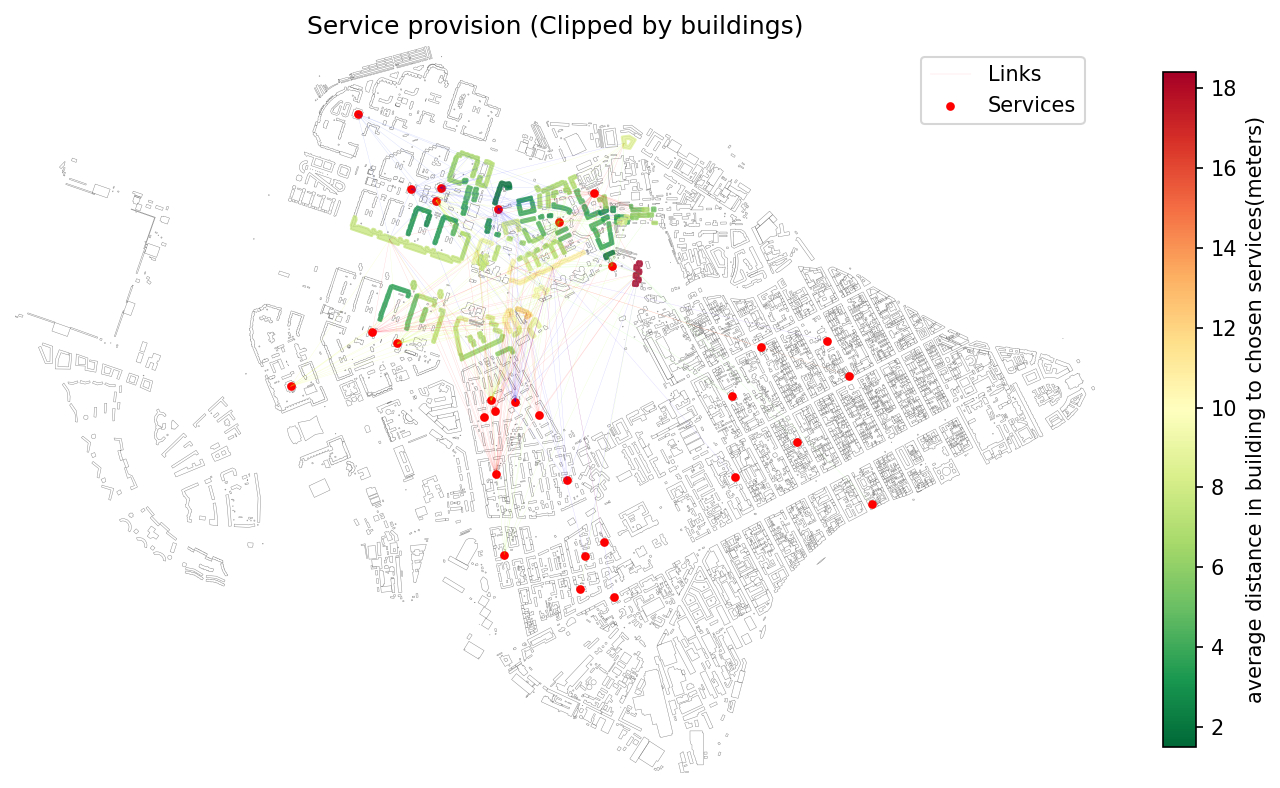
Clip to analysis area
Restricts provision output to a given geographic boundary (e.g., administrative area).
objectnat.clip_provision(buildings, services, links, selection_zone)
¶Source code in src\objectnat\methods\provision\provision.py
57 58 59 60 61 62 63 64 65 66 67 68 69 70 71 72 73 74 75 76 | |
Graph Preparation via IduEdu
For best performance and reproducibility, it is recommended to build or download intermodal graphs using the IduEdu library.
Here is a minimal example:
# Install required packages (uncomment if needed)
# !pip install iduedu

from iduedu import get_boundary, get_intermodal_graph

# Load boundary and graph for a specific region using OSM ID 1114252.
poly = get_boundary(osm_id=1114252)
G_intermodal = get_intermodal_graph(polygon=poly, clip_by_bounds=True)